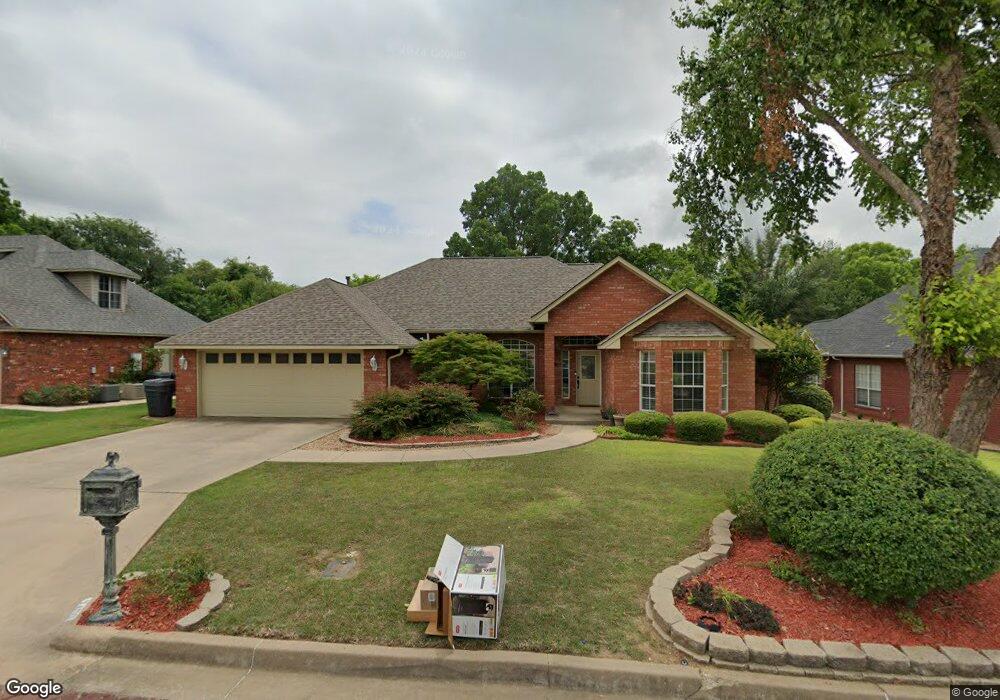
2406 S Rockford Pkwy Ardmore, OK 73401
Estimated Value: $347,794 - $439,000
3
Beds
2
Baths
2,281
Sq Ft
$166/Sq Ft
Est. Value
About This Home
This home is located at 2406 S Rockford Pkwy, Ardmore, OK 73401 and is currently estimated at $377,949, approximately $165 per square foot. 2406 S Rockford Pkwy is a home located in Carter County with nearby schools including Plainview Primary School, Plainview Intermediate School, and Plainview Middle School.
Ownership History
Date
Name
Owned For
Owner Type
Purchase Details
Closed on
Mar 8, 2024
Sold by
Jd And Ann Clowdus Living Trust
Bought by
Ann Clowdus Living Trust and Clowdus
Current Estimated Value
Purchase Details
Closed on
Dec 3, 2004
Sold by
Dobkins Ken and Dobkins Melissa D
Bought by
Cendant Mobility Financia
Purchase Details
Closed on
Dec 2, 2004
Sold by
Cendant Mobility Financia
Bought by
Clowdus Jd and Clowdus Ann Living
Purchase Details
Closed on
Jul 14, 2003
Sold by
Hollaus Dan E and Hollaus Sharon
Bought by
Dobkins Ken and Dobkins Melissa D
Purchase Details
Closed on
Mar 27, 2001
Sold by
Meacham Development Corp
Bought by
Hollaus Dan E and Hollaus Sharon
Purchase Details
Closed on
Sep 28, 1999
Sold by
U S Homeowners Associat
Bought by
Meacham Development Corp
Create a Home Valuation Report for This Property
The Home Valuation Report is an in-depth analysis detailing your home's value as well as a comparison with similar homes in the area
Home Values in the Area
Average Home Value in this Area
Purchase History
| Date | Buyer | Sale Price | Title Company |
|---|---|---|---|
| Ann Clowdus Living Trust | -- | None Listed On Document | |
| Cendant Mobility Financia | $218,000 | -- | |
| Clowdus Jd | $218,000 | -- | |
| Dobkins Ken | $210,500 | -- | |
| Hollaus Dan E | $189,000 | -- | |
| Meacham Development Corp | $17,500 | -- |
Source: Public Records
Tax History Compared to Growth
Tax History
| Year | Tax Paid | Tax Assessment Tax Assessment Total Assessment is a certain percentage of the fair market value that is determined by local assessors to be the total taxable value of land and additions on the property. | Land | Improvement |
|---|---|---|---|---|
| 2025 | $3,807 | $41,491 | $4,200 | $37,291 |
| 2024 | $3,807 | $30,439 | $4,200 | $26,239 |
| 2023 | $2,701 | $29,552 | $4,200 | $25,352 |
| 2022 | $2,508 | $28,692 | $4,200 | $24,492 |
| 2021 | $2,502 | $27,856 | $4,200 | $23,656 |
| 2020 | $2,452 | $27,045 | $4,200 | $22,845 |
| 2019 | $2,317 | $26,257 | $4,200 | $22,057 |
| 2018 | $2,224 | $25,493 | $4,200 | $21,293 |
| 2017 | $2,167 | $24,750 | $4,200 | $20,550 |
| 2016 | $2,113 | $24,029 | $4,200 | $19,829 |
| 2015 | $2,144 | $23,706 | $3,924 | $19,782 |
| 2014 | $2,305 | $25,348 | $2,700 | $22,648 |
Source: Public Records
Map
Nearby Homes
- 2412 S Rockford Pkwy
- 2410 Augusta Rd
- 58 Overland Route
- 35 Overland Route
- 811 Rosewood St
- 36 Overland Route
- 535 Sunset Dr SW
- 0 N Rockford Rd Unit 2411009
- 0 N Rockford Rd Unit 2440723
- 820 Virginia Ln
- 5 Rio Grande
- 2222 Cloverleaf Place
- 2212 Cloverleaf Place
- 2200 Cloverleaf Place
- 1804 Stanley St SW
- 824 Sunset Dr SW
- 1800 SW 6th St
- 1723 Bixby St
- 1703 3rd Ave SW
- 1006 S Rockford Rd
- 2330 S Rockford Pkwy
- 2213 S Rockford Pkwy
- 602 Pebble Beach Dr
- 2418 S Rockford Pkwy
- 2324 S Rockford Pkwy
- 510 Portico Ave
- 604 Pebble Beach Dr
- 2424 S Rockford Pkwy
- 508 Portico Ave
- 2308 S Rockford Pkwy
- 2423 S Rockford Pkwy
- 2412 Portico Ave
- 504 Portico Ave
- 2402 Augusta Rd
- 2416 Portico Ave
- 2411 Augusta Rd
- 520 Rockford Rd S
- 2420 Portico Ave
- 2307 S Rockford Pkwy
- 2429 S Rockford Pkwy