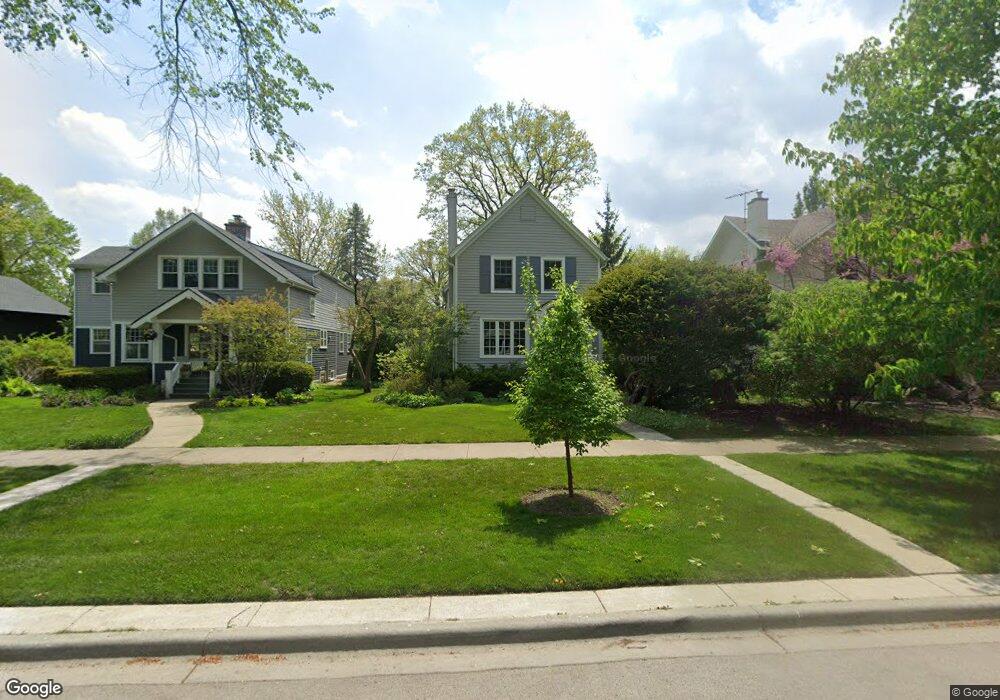
2406 Thayer St Evanston, IL 60201
Central Street NeighborhoodEstimated Value: $985,000 - $1,209,000
4
Beds
3
Baths
2,354
Sq Ft
$476/Sq Ft
Est. Value
About This Home
This home is located at 2406 Thayer St, Evanston, IL 60201 and is currently estimated at $1,120,779, approximately $476 per square foot. 2406 Thayer St is a home located in Cook County with nearby schools including Kingsley Elementary School, Haven Middle School, and Evanston Township High School.
Ownership History
Date
Name
Owned For
Owner Type
Purchase Details
Closed on
Dec 9, 2009
Sold by
Phillips Michael and Zimring Julie
Bought by
Zimring Julie M and The Julie M Zimring Revocable Trust
Current Estimated Value
Purchase Details
Closed on
May 25, 2004
Sold by
Moore Ken and Freemal Beth J
Bought by
Phillips Michael and Zimring Julie
Home Financials for this Owner
Home Financials are based on the most recent Mortgage that was taken out on this home.
Original Mortgage
$333,700
Outstanding Balance
$162,561
Interest Rate
6.39%
Mortgage Type
Stand Alone First
Estimated Equity
$958,218
Purchase Details
Closed on
Aug 1, 2002
Sold by
Martin Lawrence and Martin Catherine E
Bought by
Moore Ken and Freemal Beth J
Home Financials for this Owner
Home Financials are based on the most recent Mortgage that was taken out on this home.
Original Mortgage
$450,000
Interest Rate
6.64%
Create a Home Valuation Report for This Property
The Home Valuation Report is an in-depth analysis detailing your home's value as well as a comparison with similar homes in the area
Home Values in the Area
Average Home Value in this Area
Purchase History
| Date | Buyer | Sale Price | Title Company |
|---|---|---|---|
| Zimring Julie M | -- | None Available | |
| Phillips Michael | $600,000 | Multiple | |
| Moore Ken | $562,500 | Burnet Title Llc |
Source: Public Records
Mortgage History
| Date | Status | Borrower | Loan Amount |
|---|---|---|---|
| Open | Phillips Michael | $333,700 | |
| Previous Owner | Moore Ken | $450,000 |
Source: Public Records
Tax History
| Year | Tax Paid | Tax Assessment Tax Assessment Total Assessment is a certain percentage of the fair market value that is determined by local assessors to be the total taxable value of land and additions on the property. | Land | Improvement |
|---|---|---|---|---|
| 2025 | $17,985 | $98,546 | $20,250 | $78,296 |
| 2024 | $17,985 | $77,609 | $17,250 | $60,359 |
| 2023 | $17,233 | $77,609 | $17,250 | $60,359 |
| 2022 | $17,233 | $77,609 | $17,250 | $60,359 |
| 2021 | $18,577 | $73,331 | $11,250 | $62,081 |
| 2020 | $18,388 | $73,331 | $11,250 | $62,081 |
| 2019 | $17,933 | $79,969 | $11,250 | $68,719 |
| 2018 | $18,878 | $72,340 | $9,375 | $62,965 |
| 2017 | $18,401 | $72,340 | $9,375 | $62,965 |
| 2016 | $17,675 | $72,340 | $9,375 | $62,965 |
| 2015 | $15,552 | $60,625 | $7,875 | $52,750 |
| 2014 | $15,419 | $60,625 | $7,875 | $52,750 |
| 2013 | $15,048 | $60,625 | $7,875 | $52,750 |
Source: Public Records
Map
Nearby Homes
- 2508 Isabella St
- 2731 Park Place
- 1209 Maple Ave
- 1241 Maple Ave
- 2716 Ewing Ave
- 2726 Central St Unit 3D
- 2108 Harrison St
- 2647 Poplar Ave
- 2732 Lincolnwood Dr
- 1531 Wilmette Ave
- 1511 Central Ave
- 1915 - 2 Grant St
- 2422 Grant St
- 320 Central Park Ave
- 2951 Colfax St
- 128 Lawndale St
- 1915 Grant St
- 621 Green Bay Rd
- 526 Linden Ave
- 3131 Central St
- 2410 Thayer St
- 2400 Thayer St
- 2414 Thayer St
- 2330 Thayer St
- 2326 Thayer St
- 2416 Thayer St
- 2407 Park Place
- 2411 Park Place
- 2401 Park Place
- 2413 Park Place
- 2320 Thayer St
- 2337 Park Place
- 2337 Park Place Unit 1
- 2407 Thayer St
- 2419 Park Place
- 2327 Park Place
- 2403 Thayer St
- 2409 Thayer St
- 2331 Thayer St
- 2413 Thayer St