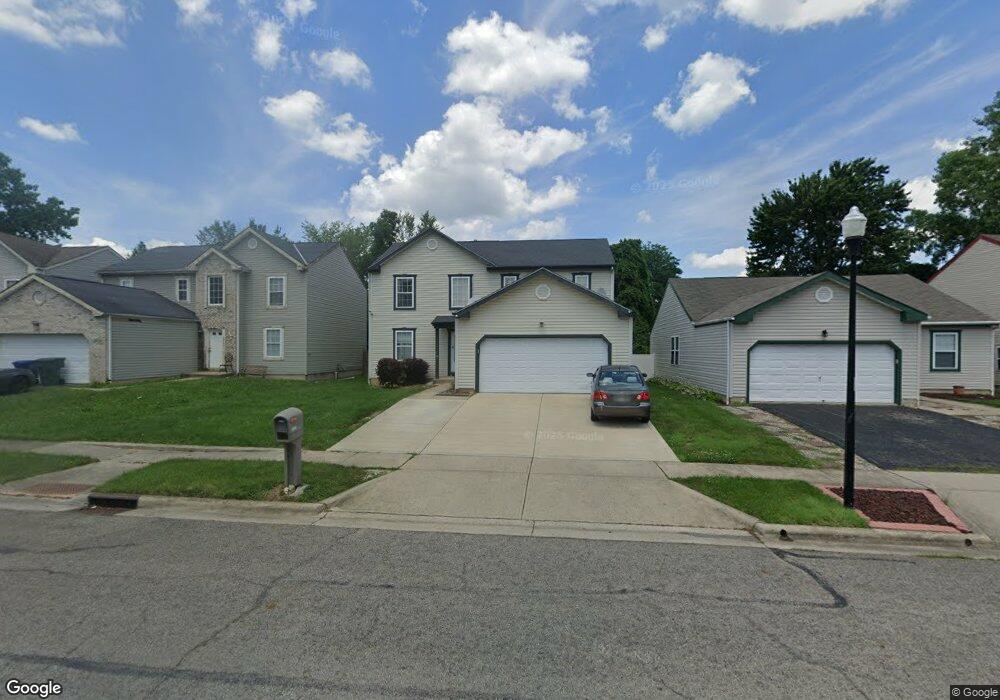
2406 Vining Dr Columbus, OH 43229
Forest Park East NeighborhoodEstimated Value: $340,127 - $386,000
3
Beds
3
Baths
2,156
Sq Ft
$170/Sq Ft
Est. Value
About This Home
This home is located at 2406 Vining Dr, Columbus, OH 43229 and is currently estimated at $365,532, approximately $169 per square foot. 2406 Vining Dr is a home located in Franklin County with nearby schools including Pointview Elementary School, Genoa Middle School, and Westerville-North High School.
Ownership History
Date
Name
Owned For
Owner Type
Purchase Details
Closed on
Aug 21, 2013
Sold by
Mohamed Hussien M and Hussien Mohamed M
Bought by
Ayado Khadija M
Current Estimated Value
Purchase Details
Closed on
Nov 28, 2012
Sold by
Aos Investments Llc
Bought by
Mohamed Hussien M
Purchase Details
Closed on
Jan 25, 2011
Sold by
Danial Mamdohe M and Danial Suzan F
Bought by
Aos Investments Llc
Purchase Details
Closed on
Nov 18, 1999
Sold by
Maronda Homes Inc Of Ohio
Bought by
Danial Mamdohe M and Danial Suzan F
Home Financials for this Owner
Home Financials are based on the most recent Mortgage that was taken out on this home.
Original Mortgage
$117,978
Interest Rate
7.88%
Create a Home Valuation Report for This Property
The Home Valuation Report is an in-depth analysis detailing your home's value as well as a comparison with similar homes in the area
Home Values in the Area
Average Home Value in this Area
Purchase History
| Date | Buyer | Sale Price | Title Company |
|---|---|---|---|
| Ayado Khadija M | -- | None Available | |
| Mohamed Hussien M | $138,000 | None Available | |
| Aos Investments Llc | $133,000 | Real Living | |
| Danial Mamdohe M | $132,600 | Chicago Title |
Source: Public Records
Mortgage History
| Date | Status | Borrower | Loan Amount |
|---|---|---|---|
| Previous Owner | Danial Mamdohe M | $117,978 |
Source: Public Records
Tax History Compared to Growth
Tax History
| Year | Tax Paid | Tax Assessment Tax Assessment Total Assessment is a certain percentage of the fair market value that is determined by local assessors to be the total taxable value of land and additions on the property. | Land | Improvement |
|---|---|---|---|---|
| 2024 | $4,476 | $89,810 | $19,250 | $70,560 |
| 2023 | $4,367 | $89,810 | $19,250 | $70,560 |
| 2022 | $4,130 | $64,830 | $9,210 | $55,620 |
| 2021 | $4,171 | $64,830 | $9,210 | $55,620 |
| 2020 | $4,157 | $64,830 | $9,210 | $55,620 |
| 2019 | $3,484 | $51,840 | $7,350 | $44,490 |
| 2018 | $3,477 | $51,840 | $7,350 | $44,490 |
| 2017 | $3,415 | $51,840 | $7,350 | $44,490 |
| 2016 | $3,541 | $49,040 | $6,830 | $42,210 |
| 2015 | $3,549 | $49,040 | $6,830 | $42,210 |
| 2014 | $3,552 | $49,040 | $6,830 | $42,210 |
| 2013 | $1,951 | $54,075 | $7,175 | $46,900 |
Source: Public Records
Map
Nearby Homes
- 0 Claridon Rd
- 2244 Balmoral Rd
- 2550 Minerva Ave
- 2576 Claridon Rd
- 0 Chester Rd
- 4885 Northtowne Blvd
- 2134 Trent Rd
- 2158 Kilbourne Ave
- 4849 Heatherton Dr
- 0 Abington Rd Unit 224031739
- 0 Abington Rd Unit 224031704
- 0 Abington Rd Unit 224031738
- 0 Abington Rd Unit 225043508
- 0 Abington Rd Unit 224031699
- 0 Abington Rd Unit 225043547
- 2691 Northwold Rd
- 0 Ashbury Rd
- 5056 Northtowne Blvd Unit 5054
- 2033 Brittany Rd
- 2500 Maplewood Dr
- 2412 Vining Dr
- 2400 Vining Dr
- 2418 Vining Dr
- 2394 Vining Dr
- 4843 Bradington Ct
- 4830 Bradington Ct
- 4845 Bradington Ct
- 4832 Bradington Ct
- 2424 Vining Dr
- 2388 Vining Dr
- 2403 Vining Dr
- 2417 Vining Dr
- 4851 Bradington Ct
- 4858 Charlton Ct
- 4838 Bradington Ct
- 2397 Vining Dr
- 4856 Charlton Ct
- 2430 Vining Dr
- 2382 Vining Dr
- 4853 Bradington Ct