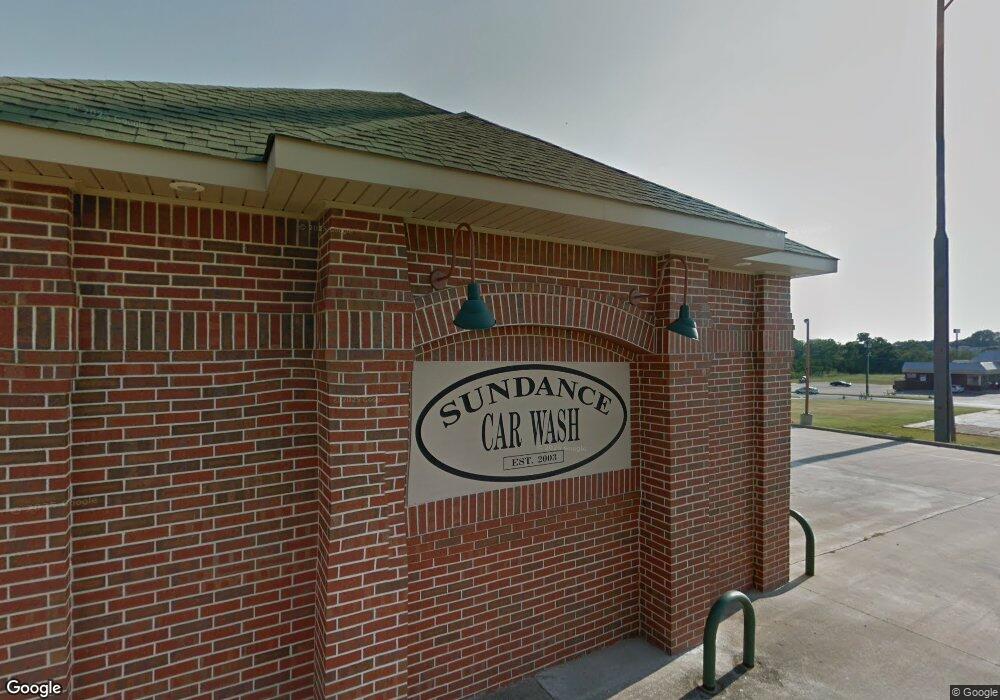
2406 W Broadway St Ardmore, OK 73401
Estimated Value: $5,062,426
--
Bed
--
Bath
846
Sq Ft
$5,984/Sq Ft
Est. Value
About This Home
This home is located at 2406 W Broadway St, Ardmore, OK 73401 and is currently priced at $5,062,426, approximately $5,983 per square foot. 2406 W Broadway St is a home located in Carter County with nearby schools including Plainview Primary School, Plainview Intermediate School, and Plainview Middle School.
Ownership History
Date
Name
Owned For
Owner Type
Purchase Details
Closed on
Dec 19, 2022
Sold by
Boing Us Holdco Inc
Bought by
Opf V International Llc
Current Estimated Value
Home Financials for this Owner
Home Financials are based on the most recent Mortgage that was taken out on this home.
Original Mortgage
$101,685,500
Outstanding Balance
$98,203,917
Interest Rate
6.58%
Mortgage Type
New Conventional
Purchase Details
Closed on
Sep 28, 2017
Sold by
Waters Teresa Lynnea
Bought by
Waters Teresa L and Waters Aldo J
Home Financials for this Owner
Home Financials are based on the most recent Mortgage that was taken out on this home.
Original Mortgage
$353,380
Interest Rate
3.86%
Mortgage Type
Commercial
Purchase Details
Closed on
Aug 12, 2002
Sold by
Jordan Distrubuting Co
Bought by
Snn Development Llc
Purchase Details
Closed on
Nov 12, 2001
Sold by
Hodges Inv Inc
Bought by
Jordan Distributing Co In
Create a Home Valuation Report for This Property
The Home Valuation Report is an in-depth analysis detailing your home's value as well as a comparison with similar homes in the area
Home Values in the Area
Average Home Value in this Area
Purchase History
| Date | Buyer | Sale Price | Title Company |
|---|---|---|---|
| Opf V International Llc | $4,099,500 | Chicago Title | |
| Waters Teresa L | -- | None Available | |
| Snn Development Llc | $280,000 | -- | |
| Jordan Distributing Co In | $147,000 | -- |
Source: Public Records
Mortgage History
| Date | Status | Borrower | Loan Amount |
|---|---|---|---|
| Open | Opf V International Llc | $101,685,500 | |
| Previous Owner | Waters Teresa L | $353,380 |
Source: Public Records
Tax History Compared to Growth
Tax History
| Year | Tax Paid | Tax Assessment Tax Assessment Total Assessment is a certain percentage of the fair market value that is determined by local assessors to be the total taxable value of land and additions on the property. | Land | Improvement |
|---|---|---|---|---|
| 2025 | $36,372 | $396,772 | $21,400 | $375,372 |
| 2024 | $36,372 | $396,772 | $21,400 | $375,372 |
| 2023 | $36,372 | $396,772 | $21,400 | $375,372 |
| 2022 | $43,474 | $480,000 | $21,400 | $458,600 |
| 2021 | $5,808 | $62,340 | $21,400 | $40,940 |
| 2020 | $5,590 | $59,371 | $21,400 | $37,971 |
| 2019 | $5,186 | $56,544 | $21,400 | $35,144 |
| 2018 | $4,890 | $53,851 | $21,400 | $32,451 |
| 2017 | $4,928 | $54,000 | $19,236 | $34,764 |
| 2016 | $4,934 | $53,771 | $19,236 | $34,535 |
| 2015 | $5,081 | $53,823 | $18,000 | $35,823 |
| 2014 | $5,210 | $55,186 | $8,832 | $46,354 |
Source: Public Records
Map
Nearby Homes
- 2412 S Rockford Pkwy
- 0 N Rockford Rd Unit 2411009
- 0 N Rockford Rd Unit 2440723
- 2410 Augusta Rd
- 35 Overland Route
- 36 Overland Route
- 58 Overland Route
- 5 Rio Grande
- 1804 Stanley St SW
- 1723 Bixby St
- 535 Sunset Dr SW
- 811 Rosewood St
- 1703 3rd Ave SW
- 820 Virginia Ln
- 1800 SW 6th St
- 2222 Cloverleaf Place
- 824 Sunset Dr SW
- 2212 Cloverleaf Place
- 307 P St SW
- 2200 Cloverleaf Place
- 420 Rockford Rd S
- 2415 Portico Ave
- 2409 Portico Ave
- 2413 Portico Ave
- 2405 Portico Ave
- 503 S Rockford Rd
- 502 S Rockford Rd
- 502 Portico Ave
- 2600 W Broadway St
- 2416 Portico Ave
- 2412 Portico Ave
- 2420 Portico Ave
- 504 Portico Ave
- 509 S Rockford Rd
- 509 S Rockford Rd
- 2430 Portico Ave
- 508 Portico Ave
- 2423 S Rockford Pkwy
- 2429 S Rockford Pkwy
- 510 Portico Ave