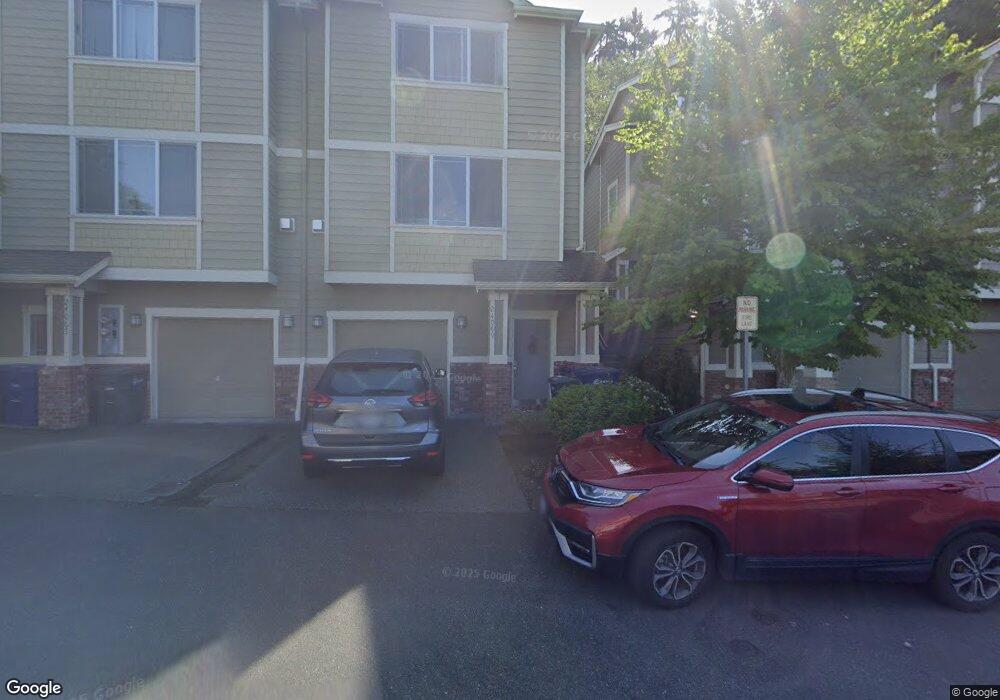
24069 40th Ln SE Bothell, WA 98021
Canyon Creek NeighborhoodEstimated Value: $697,000 - $786,000
3
Beds
3
Baths
1,504
Sq Ft
$491/Sq Ft
Est. Value
About This Home
This home is located at 24069 40th Ln SE, Bothell, WA 98021 and is currently estimated at $739,016, approximately $491 per square foot. 24069 40th Ln SE is a home located in Snohomish County with nearby schools including Woodin Elementary School, Leota Middle School, and Woodinville High School.
Ownership History
Date
Name
Owned For
Owner Type
Purchase Details
Closed on
Jun 13, 2025
Sold by
Wang Chung Zong and Shin Yih
Bought by
Wang Wei Chen and Salvo Celeste Anne
Current Estimated Value
Purchase Details
Closed on
Mar 3, 2011
Sold by
Frid Igor and Frid Olga
Bought by
Wang Chung Zong and Wang Shin Yih
Purchase Details
Closed on
May 17, 2007
Sold by
Razumovich Victor and Razumovich Olga
Bought by
Frid Igor and Frid Olga
Home Financials for this Owner
Home Financials are based on the most recent Mortgage that was taken out on this home.
Original Mortgage
$308,800
Interest Rate
1%
Mortgage Type
Negative Amortization
Purchase Details
Closed on
Mar 14, 2007
Sold by
Tiburon Heights Llc
Bought by
Razumovich Viktor and Razumovich Olga
Home Financials for this Owner
Home Financials are based on the most recent Mortgage that was taken out on this home.
Original Mortgage
$282,500
Interest Rate
7.62%
Mortgage Type
Unknown
Create a Home Valuation Report for This Property
The Home Valuation Report is an in-depth analysis detailing your home's value as well as a comparison with similar homes in the area
Home Values in the Area
Average Home Value in this Area
Purchase History
| Date | Buyer | Sale Price | Title Company |
|---|---|---|---|
| Wang Wei Chen | $313 | None Listed On Document | |
| Wang Chung Zong | $199,280 | Fidelity National Title | |
| Frid Igor | $386,000 | Fidelity National Title | |
| Razumovich Viktor | $353,228 | Chicago Title |
Source: Public Records
Mortgage History
| Date | Status | Borrower | Loan Amount |
|---|---|---|---|
| Previous Owner | Frid Igor | $308,800 | |
| Previous Owner | Razumovich Viktor | $282,500 |
Source: Public Records
Tax History
| Year | Tax Paid | Tax Assessment Tax Assessment Total Assessment is a certain percentage of the fair market value that is determined by local assessors to be the total taxable value of land and additions on the property. | Land | Improvement |
|---|---|---|---|---|
| 2025 | $5,549 | $681,000 | $456,000 | $225,000 |
| 2024 | $5,549 | $656,900 | $440,000 | $216,900 |
| 2023 | $5,562 | $724,800 | $475,000 | $249,800 |
| 2022 | $5,037 | $529,500 | $290,000 | $239,500 |
| 2020 | $4,270 | $414,500 | $210,000 | $204,500 |
| 2019 | $3,861 | $388,400 | $185,000 | $203,400 |
| 2018 | $3,432 | $332,000 | $150,000 | $182,000 |
| 2017 | $3,116 | $305,300 | $135,000 | $170,300 |
| 2016 | $2,878 | $291,400 | $115,000 | $176,400 |
| 2015 | $2,818 | $270,400 | $100,000 | $170,400 |
| 2013 | $2,470 | $208,400 | $70,000 | $138,400 |
Source: Public Records
Map
Nearby Homes
- 3926 243rd Place SE Unit H101
- 3901 243rd Place SE Unit O302
- 3915 243rd Place SE Unit K101
- 3914 243rd Place SE Unit L301
- 23718 43rd Dr SE
- 4418 242nd Place SE
- 12012 NE 204th Place Unit C203
- 4422 237th Place SE
- 12023 NE 204th Place Unit E302
- 23962 36th Ave SE
- 23962 36th Ave SE Unit 4
- 24228 47th Ave SE
- 23743 35th Dr SE Unit 40
- 23962 35th Dr SE Unit 36
- 24309 47th Ave SE
- 23736 35th Dr SE
- 23736 35th Dr SE Unit 42
- 3516 237th St SE Unit 46
- 3508 237th St SE Unit 47
- 3509 237th St SE Unit 27
- 24065 40th Ln SE
- 24065 40th Ln SE Unit 38
- 24127 40th Ln SE Unit 36
- 24061 40th Ln SE
- 24129 40th Ln SE
- 24129 40th Ln SE Unit 35
- 24024 41st Ave SE Unit 16
- 24057 40th Ln SE Unit 40
- 24020 41st Ave SE Unit 17
- 24066 40th Ln SE Unit 29
- 24053 40th Ln SE Unit 41
- 24064 40th Ln SE Unit 30
- 24016 41st Ave SE Unit 18
- 24049 40th Ln SE
- 24059 40th Ave SE
- 24055 40th Ave SE Unit 27
- 24054 40th Ln SE Unit 31
- 24045 40th Ln SE Unit 43
- 24131 40th Ave SE Unit PH 9
- 24023 41st Ave SE Unit 15
Your Personal Tour Guide
Ask me questions while you tour the home.