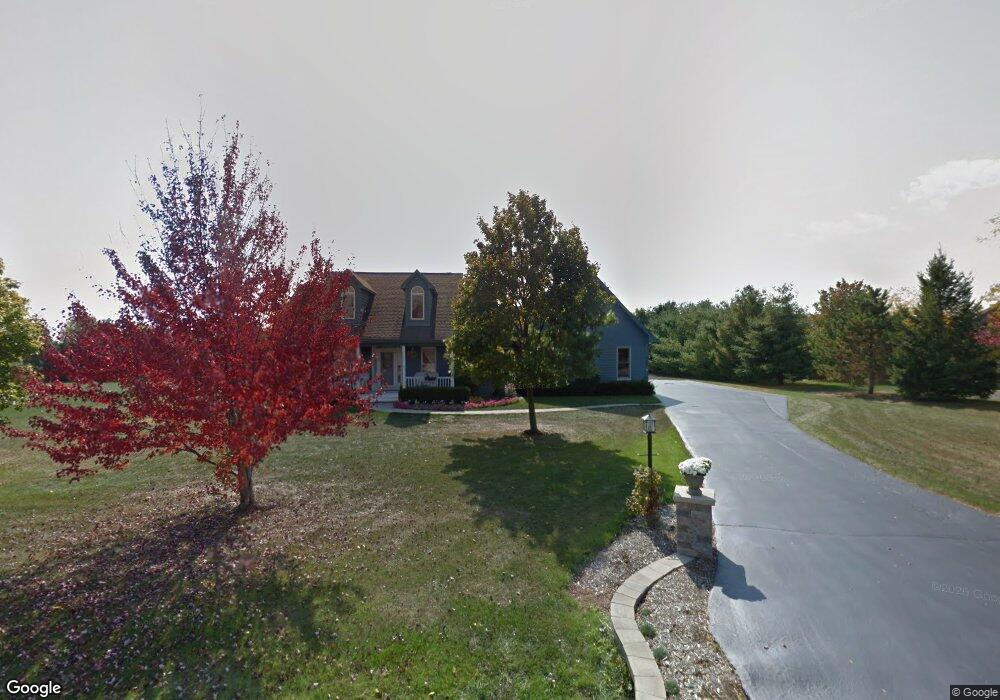
2407 Fox Bluff Ln Spring Grove, IL 60081
Estimated Value: $426,585 - $528,000
3
Beds
--
Bath
1,932
Sq Ft
$246/Sq Ft
Est. Value
About This Home
This home is located at 2407 Fox Bluff Ln, Spring Grove, IL 60081 and is currently estimated at $475,396, approximately $246 per square foot. 2407 Fox Bluff Ln is a home located in McHenry County with nearby schools including Richmond Grade School, Nippersink Middle School, and Richmond-Burton High School.
Ownership History
Date
Name
Owned For
Owner Type
Purchase Details
Closed on
Jul 23, 2020
Sold by
Miller Marlene Joanne
Bought by
Miller Marlene Joanne and Miller Marlene Joanne
Current Estimated Value
Purchase Details
Closed on
Nov 10, 2018
Sold by
Miller Gregory A
Bought by
Miller Marlene J
Purchase Details
Closed on
Sep 20, 1999
Sold by
Torgerson John
Bought by
Miller Gregory A and Edwards Miller Marlene J
Home Financials for this Owner
Home Financials are based on the most recent Mortgage that was taken out on this home.
Original Mortgage
$120,000
Interest Rate
7.78%
Purchase Details
Closed on
Jun 4, 1997
Sold by
Torgerson John
Bought by
Torgerson John and Torgerson David W
Purchase Details
Closed on
Jan 6, 1995
Sold by
Chicago Title & Trust Company
Bought by
Torgerson John W
Create a Home Valuation Report for This Property
The Home Valuation Report is an in-depth analysis detailing your home's value as well as a comparison with similar homes in the area
Home Values in the Area
Average Home Value in this Area
Purchase History
| Date | Buyer | Sale Price | Title Company |
|---|---|---|---|
| Miller Marlene Joanne | -- | None Available | |
| Miller Marlene J | -- | Attorney | |
| Miller Gregory A | $197,000 | Attorneys Title Guaranty Fun | |
| Torgerson John | -- | -- | |
| Torgerson John | -- | -- | |
| Torgerson John W | $35,500 | Chicago Title |
Source: Public Records
Mortgage History
| Date | Status | Borrower | Loan Amount |
|---|---|---|---|
| Previous Owner | Miller Gregory A | $120,000 |
Source: Public Records
Tax History
| Year | Tax Paid | Tax Assessment Tax Assessment Total Assessment is a certain percentage of the fair market value that is determined by local assessors to be the total taxable value of land and additions on the property. | Land | Improvement |
|---|---|---|---|---|
| 2024 | $8,766 | $122,612 | $24,399 | $98,213 |
| 2023 | $8,512 | $112,087 | $22,305 | $89,782 |
| 2022 | $8,222 | $100,925 | $20,084 | $80,841 |
| 2021 | $7,719 | $94,126 | $19,276 | $74,850 |
| 2020 | $7,595 | $90,567 | $18,547 | $72,020 |
| 2019 | $7,506 | $87,657 | $17,951 | $69,706 |
| 2018 | $7,569 | $84,035 | $17,209 | $66,826 |
| 2017 | $7,566 | $80,026 | $16,388 | $63,638 |
| 2016 | $7,444 | $75,029 | $15,365 | $59,664 |
| 2013 | -- | $70,940 | $14,527 | $56,413 |
Source: Public Records
Map
Nearby Homes
- 2102 W Hunters Ln
- 2919 Il Route 173
- 11013 Serenity Path
- 1914 Spring Dale Dr
- 11101 Serenity Path
- 10905 Breezy Lawn Rd
- 9436 Bellaire Ln
- 10105 N Clark Rd
- 11111 Huron Dr
- 11106 Siedschlag Rd
- Lot 16 Harding
- Lot 17 & 18 Harding Ave
- 3159 E Lakeshore Dr
- Lt1 Majestic Way W
- 2611 E Lake Shore Dr
- Lt17 Majestic Way E
- 2214 Main Street Rd
- 2044 Matthew Ave
- 8610 Steeple Ln
- 8501 Country Shire Ln
- 2415 Fox Bluff Ln Unit 2
- 2317 Fox Bluff Ln Unit 2
- 2406 Falcon Ln
- 2406 Fox Bluff Ln
- 2320 Falcon Ln
- 2412 Fox Bluff Ln
- 2312 Falcon Ln Unit 2
- 2320 Fox Bluff Ln Unit 2
- 10405 Steeplechase Ln
- 10321 Steeplechase Ln
- 2308 Falcon Ln
- 2311 Fox Bluff Ln
- 10315 Steeplechase Ln Unit 1
- 2405 Falcon Ln
- 2413 Falcon Ln
- 2312 Fox Bluff Ln
- 2319 Falcon Ln Unit 2
- 2315 Falcon Ln
- 2311 Falcon Ln
- 10309 Steeplechase Ln
Your Personal Tour Guide
Ask me questions while you tour the home.