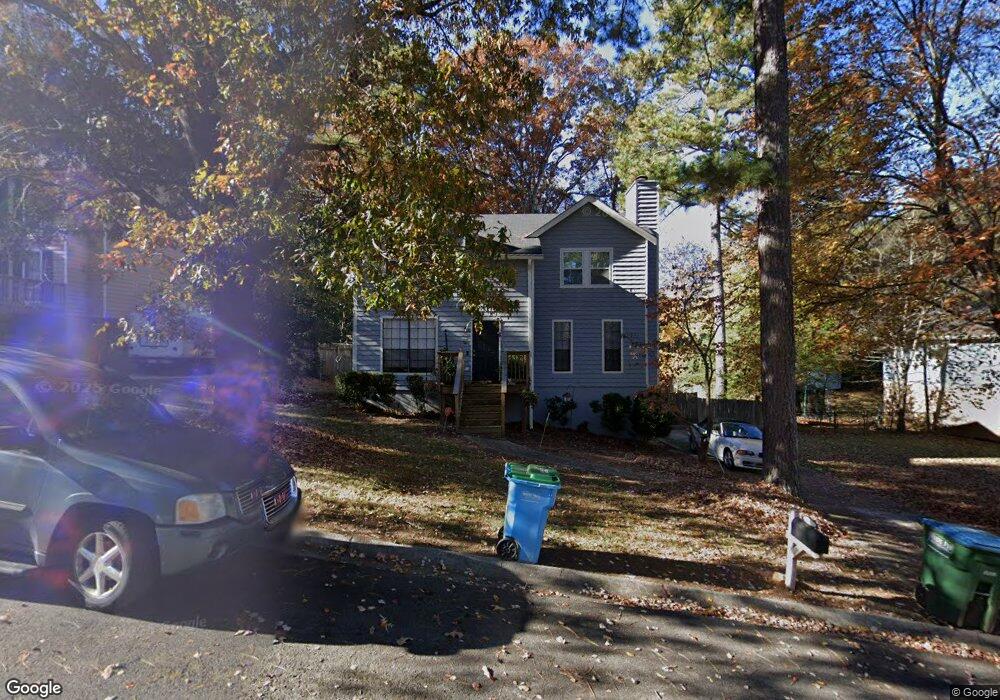
2407 Northbrook Rd Snellville, GA 30039
Estimated Value: $279,000 - $339,996
3
Beds
3
Baths
1,872
Sq Ft
$162/Sq Ft
Est. Value
About This Home
This home is located at 2407 Northbrook Rd, Snellville, GA 30039 and is currently estimated at $303,749, approximately $162 per square foot. 2407 Northbrook Rd is a home located in Gwinnett County with nearby schools including Shiloh Elementary School, Shiloh Middle School, and Shiloh High School.
Ownership History
Date
Name
Owned For
Owner Type
Purchase Details
Closed on
Sep 27, 2019
Sold by
Mupr 3 Assets Llc
Bought by
Srmz 4 Asset Co 1 Llc
Current Estimated Value
Purchase Details
Closed on
Mar 6, 2018
Sold by
Wilson Valerie
Bought by
Mupr 3 Assets Llc
Purchase Details
Closed on
Dec 29, 2006
Sold by
Regions Bk
Bought by
Wilson Valerie
Home Financials for this Owner
Home Financials are based on the most recent Mortgage that was taken out on this home.
Original Mortgage
$133,100
Interest Rate
6.06%
Mortgage Type
VA
Purchase Details
Closed on
Jan 7, 2006
Sold by
Federal Natl Mtg Assn Fnma
Bought by
Regions Bk
Purchase Details
Closed on
Oct 4, 2005
Sold by
Regions Mtg Inc
Bought by
Federal Natl Mtg Assn Fnma
Purchase Details
Closed on
May 17, 2002
Sold by
Krapes Michael
Bought by
Krapes Michael and Krapes Patricia
Create a Home Valuation Report for This Property
The Home Valuation Report is an in-depth analysis detailing your home's value as well as a comparison with similar homes in the area
Home Values in the Area
Average Home Value in this Area
Purchase History
| Date | Buyer | Sale Price | Title Company |
|---|---|---|---|
| Srmz 4 Asset Co 1 Llc | $928,185 | -- | |
| Mupr 3 Assets Llc | $113,000 | -- | |
| Wilson Valerie | $130,000 | -- | |
| Regions Bk | -- | -- | |
| Federal Natl Mtg Assn Fnma | -- | -- | |
| Regions Mtg Inc | $149,816 | -- | |
| Krapes Michael | -- | -- |
Source: Public Records
Mortgage History
| Date | Status | Borrower | Loan Amount |
|---|---|---|---|
| Previous Owner | Wilson Valerie | $133,100 |
Source: Public Records
Tax History Compared to Growth
Tax History
| Year | Tax Paid | Tax Assessment Tax Assessment Total Assessment is a certain percentage of the fair market value that is determined by local assessors to be the total taxable value of land and additions on the property. | Land | Improvement |
|---|---|---|---|---|
| 2024 | $4,272 | $111,200 | $17,200 | $94,000 |
| 2023 | $4,272 | $111,200 | $17,200 | $94,000 |
| 2022 | $3,267 | $111,800 | $17,200 | $94,600 |
| 2021 | $3,310 | $84,360 | $12,400 | $71,960 |
| 2020 | $3,328 | $84,360 | $12,400 | $71,960 |
| 2019 | $1,841 | $45,200 | $10,000 | $35,200 |
| 2018 | $1,866 | $53,410 | $8,500 | $44,910 |
| 2016 | $1,777 | $48,920 | $8,000 | $40,920 |
| 2015 | $1,334 | $35,880 | $4,000 | $31,880 |
| 2014 | -- | $35,880 | $4,000 | $31,880 |
Source: Public Records
Map
Nearby Homes
- 3919 Valley Brook Rd
- 3948 Valley Brook Rd
- 4179 White Rd
- 3932 Ferncliff Rd
- 3963 Ferncliff Rd
- 3893 Tanglewood Rd
- 0 Shiloh Ridge Trail Unit 10610727
- 0 Shiloh Ridge Trail Unit 7653629
- 2252 Wellington Hills Way
- 3777 Oakland Spring Ct
- 4200 Na Ah Tee Trail
- 2650 Wendell Creek Ln
- 4248 Wellington Hills Ln
- 2315 Oakland Spring Dr
- 2633 Brannan Rd
- 3738 Burnt Leaf Ln
- 3774 Eli Dr
- 1547 Paxton Dr SW
- 3695 Winterberry Ln
- 2415 Northbrook Rd
- 2399 Northbrook Rd
- 4088 Cumberland Dr
- 2423 Northbrook Rd
- 4064 Cumberland Dr Unit 1
- 0 Northbrook Rd Unit 7150339
- 0 Northbrook Rd Unit 8750079
- 0 Northbrook Rd Unit 8698885
- 0 Northbrook Rd Unit 8616957
- 0 Northbrook Rd Unit 8299986
- 0 Northbrook Rd Unit 8273008
- 0 Northbrook Rd Unit 8240209
- 0 Northbrook Rd Unit 8194989
- 0 Northbrook Rd Unit 8140162
- 0 Northbrook Rd Unit 3169293
- 0 Northbrook Rd Unit 3231872
- 0 Northbrook Rd Unit 7410633
- 0 Northbrook Rd Unit 7352761
- 0 Northbrook Rd Unit 7219489
- 0 Northbrook Rd Unit 7100390