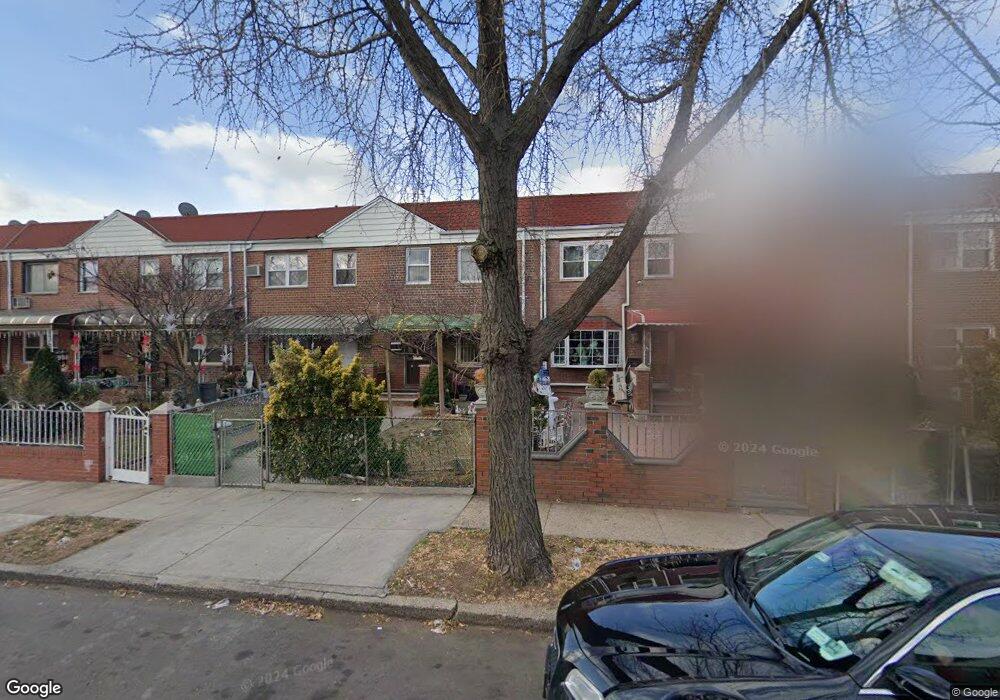
2408 88th St East Elmhurst, NY 11369
Jackson Heights NeighborhoodEstimated Value: $829,944 - $914,000
--
Bed
--
Bath
1,224
Sq Ft
$715/Sq Ft
Est. Value
About This Home
This home is located at 2408 88th St, East Elmhurst, NY 11369 and is currently estimated at $875,236, approximately $715 per square foot. 2408 88th St is a home located in Queens County with nearby schools including P.S. 127 Aerospace Science Magnet School, Is 141 The Steinway, and William Cullen Bryant High School.
Ownership History
Date
Name
Owned For
Owner Type
Purchase Details
Closed on
Apr 24, 2002
Sold by
Ruiz Jose and Ruiz Ana
Bought by
Rojas Victor and Rojas Catalina
Current Estimated Value
Home Financials for this Owner
Home Financials are based on the most recent Mortgage that was taken out on this home.
Original Mortgage
$255,200
Outstanding Balance
$106,472
Interest Rate
6.9%
Estimated Equity
$768,764
Purchase Details
Closed on
Nov 19, 1999
Sold by
Gabby Properties Inc
Bought by
Ruiz Jose and Ruiz Ana
Home Financials for this Owner
Home Financials are based on the most recent Mortgage that was taken out on this home.
Original Mortgage
$227,050
Interest Rate
7.73%
Purchase Details
Closed on
Aug 25, 1999
Sold by
Cortes Jose Guillermo and Cortes Clara I
Bought by
Gabby Properties Inc
Create a Home Valuation Report for This Property
The Home Valuation Report is an in-depth analysis detailing your home's value as well as a comparison with similar homes in the area
Home Values in the Area
Average Home Value in this Area
Purchase History
| Date | Buyer | Sale Price | Title Company |
|---|---|---|---|
| Rojas Victor | -- | -- | |
| Ruiz Jose | $239,000 | Stewart Title Insurance Co | |
| Gabby Properties Inc | $182,000 | Old Republic Natl Title Ins |
Source: Public Records
Mortgage History
| Date | Status | Borrower | Loan Amount |
|---|---|---|---|
| Open | Rojas Victor | $255,200 | |
| Previous Owner | Ruiz Jose | $227,050 |
Source: Public Records
Tax History Compared to Growth
Tax History
| Year | Tax Paid | Tax Assessment Tax Assessment Total Assessment is a certain percentage of the fair market value that is determined by local assessors to be the total taxable value of land and additions on the property. | Land | Improvement |
|---|---|---|---|---|
| 2025 | $7,115 | $39,035 | $5,818 | $33,217 |
| 2024 | $7,127 | $36,826 | $5,154 | $31,672 |
| 2023 | $6,816 | $35,338 | $5,210 | $30,128 |
| 2022 | $6,768 | $43,800 | $7,440 | $36,360 |
| 2021 | $6,960 | $46,680 | $7,440 | $39,240 |
| 2020 | $6,589 | $41,160 | $7,440 | $33,720 |
| 2019 | $6,127 | $41,040 | $7,440 | $33,600 |
| 2018 | $5,705 | $29,448 | $5,824 | $23,624 |
| 2017 | $5,703 | $29,448 | $6,955 | $22,493 |
| 2016 | $5,434 | $29,448 | $6,955 | $22,493 |
| 2015 | $3,178 | $27,108 | $8,097 | $19,011 |
| 2014 | $3,178 | $25,574 | $7,622 | $17,952 |
Source: Public Records
Map
Nearby Homes