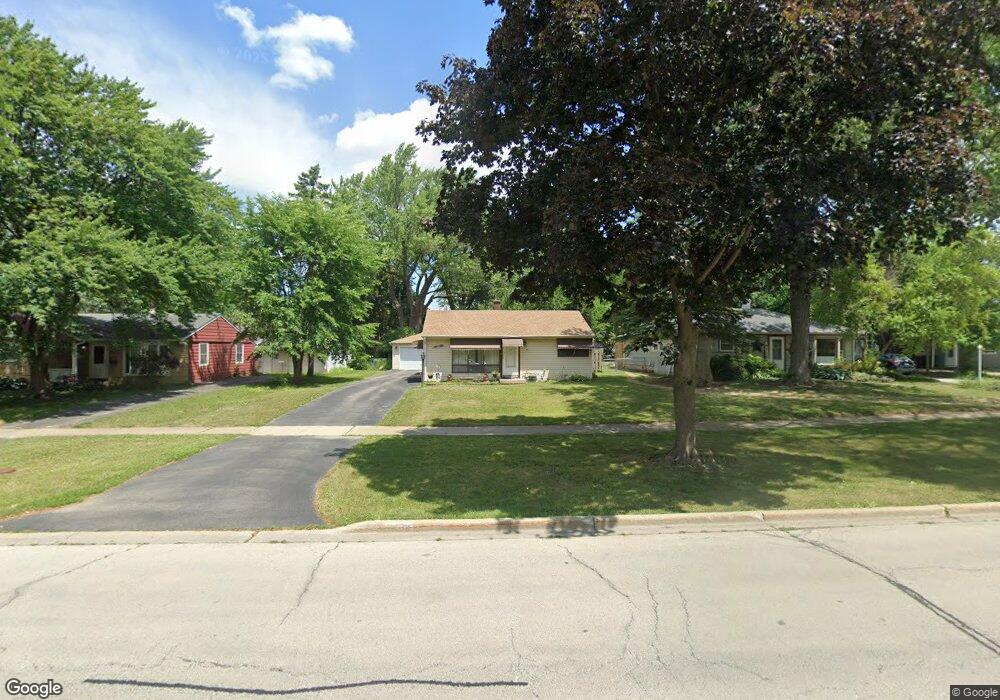
2408 Campbell St Rolling Meadows, IL 60008
Estimated Value: $290,000 - $311,000
2
Beds
1
Bath
960
Sq Ft
$313/Sq Ft
Est. Value
About This Home
This home is located at 2408 Campbell St, Rolling Meadows, IL 60008 and is currently estimated at $300,782, approximately $313 per square foot. 2408 Campbell St is a home located in Cook County with nearby schools including Kimball Hill Elementary School, Carl Sandburg Junior High School, and Rolling Meadows High School.
Ownership History
Date
Name
Owned For
Owner Type
Purchase Details
Closed on
Dec 3, 2005
Sold by
Martinez Juan F and Martinez Irma
Bought by
Martinez Juan and Martinez Irma
Current Estimated Value
Home Financials for this Owner
Home Financials are based on the most recent Mortgage that was taken out on this home.
Original Mortgage
$200,000
Interest Rate
6.48%
Mortgage Type
New Conventional
Purchase Details
Closed on
May 11, 1998
Sold by
Knopf Diane R
Bought by
Martinez Juan F and Martinez Irma
Home Financials for this Owner
Home Financials are based on the most recent Mortgage that was taken out on this home.
Original Mortgage
$118,750
Interest Rate
7.27%
Purchase Details
Closed on
Feb 4, 1995
Sold by
Knopf Diane R
Bought by
Knopf Diane R
Create a Home Valuation Report for This Property
The Home Valuation Report is an in-depth analysis detailing your home's value as well as a comparison with similar homes in the area
Home Values in the Area
Average Home Value in this Area
Purchase History
| Date | Buyer | Sale Price | Title Company |
|---|---|---|---|
| Martinez Juan | -- | Rtc | |
| Martinez Juan F | $125,000 | -- | |
| Knopf Diane R | -- | -- |
Source: Public Records
Mortgage History
| Date | Status | Borrower | Loan Amount |
|---|---|---|---|
| Closed | Martinez Juan | $200,000 | |
| Closed | Martinez Juan F | $118,750 |
Source: Public Records
Tax History
| Year | Tax Paid | Tax Assessment Tax Assessment Total Assessment is a certain percentage of the fair market value that is determined by local assessors to be the total taxable value of land and additions on the property. | Land | Improvement |
|---|---|---|---|---|
| 2025 | $4,913 | $28,000 | $6,746 | $21,254 |
| 2024 | $4,913 | $22,849 | $5,709 | $17,140 |
| 2023 | $4,650 | $22,849 | $5,709 | $17,140 |
| 2022 | $4,650 | $22,849 | $5,709 | $17,140 |
| 2021 | $3,846 | $17,607 | $3,373 | $14,234 |
| 2020 | $4,690 | $17,607 | $3,373 | $14,234 |
| 2019 | $4,726 | $19,673 | $3,373 | $16,300 |
| 2018 | $4,623 | $17,710 | $3,113 | $14,597 |
| 2017 | $4,548 | $17,710 | $3,113 | $14,597 |
| 2016 | $4,497 | $17,710 | $3,113 | $14,597 |
| 2015 | $3,850 | $14,852 | $2,854 | $11,998 |
| 2014 | $3,775 | $14,852 | $2,854 | $11,998 |
| 2013 | $3,666 | $14,852 | $2,854 | $11,998 |
Source: Public Records
Map
Nearby Homes
- 2705 Park St
- 2709 Lily Ln
- 3306 Trillium Cir Unit 3001
- 3209 Trillium Cir
- 2201 Kingfisher Ln
- 3100 Town Square Dr Unit 308
- 3100 Town Square Dr Unit 204
- 3135 Town Square Dr Unit 401
- 3135 Town Square Dr Unit 104
- 1215 W Sigwalt St Unit A
- 3265 Kirchoff Rd Unit 116
- 3605 Oriole Ln
- 3345 Kirchoff Rd Unit 5C
- 3200 Thrush Ln
- 408 N Kennicott Ave
- 3710 Meadow Dr
- 912 N Chicago Ave
- 3712 Jay Ln
- 2401 Rohlwing Rd
- 27 S Kaspar Ave
- 2406 Campbell St
- 2410 Campbell St
- 2412 Campbell St
- 2407 Wing St
- 2409 Wing St
- 2402 Campbell St
- 2500 Campbell St
- 2405 Wing St
- 2411 Wing St
- 2403 Wing St
- 2400 Campbell St
- 2502 Campbell St
- 2407 Campbell St
- 2405 Campbell St
- 2409 Campbell St
- 2403 Campbell St
- 2401 Campbell St
- 2401 Wing St
- 2501 Campbell St
- 2312 Campbell St
Your Personal Tour Guide
Ask me questions while you tour the home.