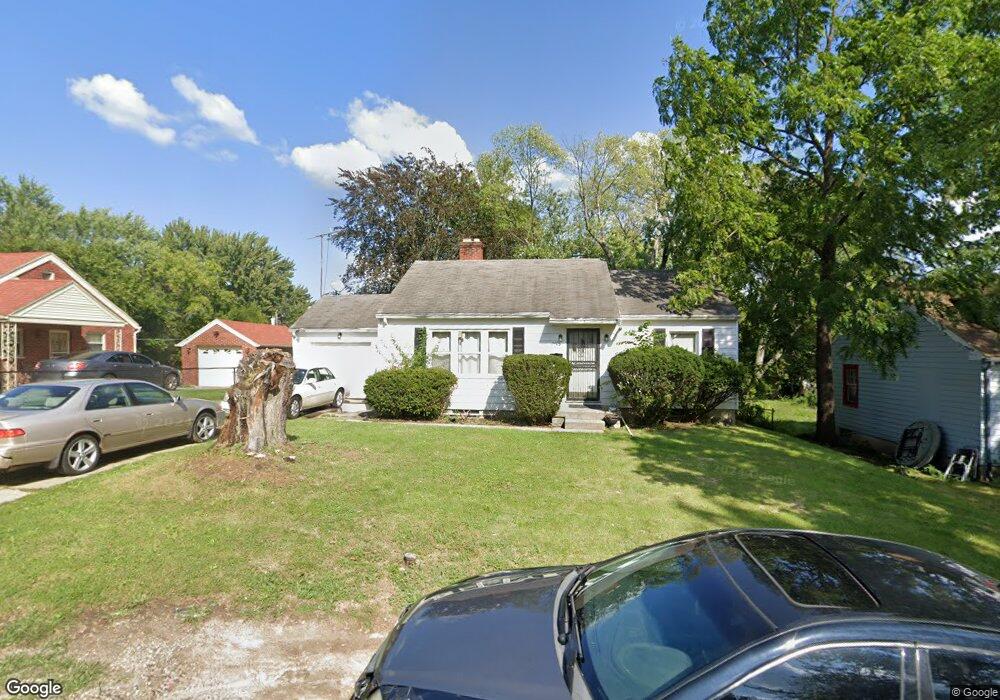
2408 Fairport Ave Dayton, OH 45406
Fort McKinley NeighborhoodEstimated Value: $67,047 - $81,000
2
Beds
1
Bath
904
Sq Ft
$80/Sq Ft
Est. Value
About This Home
This home is located at 2408 Fairport Ave, Dayton, OH 45406 and is currently estimated at $72,762, approximately $80 per square foot. 2408 Fairport Ave is a home located in Montgomery County with nearby schools including Valerie Elementary School, Imagine Klepinger Road Community School, and North Dayton School of Science & Discovery.
Ownership History
Date
Name
Owned For
Owner Type
Purchase Details
Closed on
Jun 25, 2013
Sold by
Andebrhan Elias
Bought by
E&Aab Llc
Current Estimated Value
Purchase Details
Closed on
Jan 19, 2010
Sold by
Secretary Of Housing & Urban Development
Bought by
Anderbrhan Elias
Purchase Details
Closed on
Jun 12, 2009
Sold by
Chase Home Finance Llc
Bought by
Secretary Of Housing & Urban Development
Purchase Details
Closed on
May 27, 2009
Sold by
Buford James E
Bought by
Chase Home Finance Llc
Purchase Details
Closed on
Jan 22, 2007
Sold by
Sumerlin Kim and Sumerlin Michele D
Bought by
Buford James E
Home Financials for this Owner
Home Financials are based on the most recent Mortgage that was taken out on this home.
Original Mortgage
$59,529
Interest Rate
6.19%
Mortgage Type
FHA
Purchase Details
Closed on
Aug 23, 2005
Sold by
Franklin Credit Management
Bought by
Sumerlin Kim and Sumerlin Michele D
Purchase Details
Closed on
Mar 22, 1982
Sold by
Darr Noble J
Create a Home Valuation Report for This Property
The Home Valuation Report is an in-depth analysis detailing your home's value as well as a comparison with similar homes in the area
Home Values in the Area
Average Home Value in this Area
Purchase History
| Date | Buyer | Sale Price | Title Company |
|---|---|---|---|
| E&Aab Llc | -- | None Available | |
| Anderbrhan Elias | $8,000 | Attorney | |
| Secretary Of Housing & Urban Development | -- | None Available | |
| Chase Home Finance Llc | $20,000 | None Available | |
| Buford James E | $60,000 | Attorney | |
| Sumerlin Kim | $21,000 | -- | |
| -- | -- | -- |
Source: Public Records
Mortgage History
| Date | Status | Borrower | Loan Amount |
|---|---|---|---|
| Previous Owner | Buford James E | $59,529 |
Source: Public Records
Tax History Compared to Growth
Tax History
| Year | Tax Paid | Tax Assessment Tax Assessment Total Assessment is a certain percentage of the fair market value that is determined by local assessors to be the total taxable value of land and additions on the property. | Land | Improvement |
|---|---|---|---|---|
| 2024 | $828 | $10,940 | $3,340 | $7,600 |
| 2023 | $828 | $10,940 | $3,340 | $7,600 |
| 2022 | $987 | $8,420 | $2,570 | $5,850 |
| 2021 | $862 | $8,420 | $2,570 | $5,850 |
| 2020 | $860 | $8,420 | $2,570 | $5,850 |
| 2019 | $1,065 | $9,400 | $2,310 | $7,090 |
| 2018 | $1,066 | $9,400 | $2,310 | $7,090 |
| 2017 | $1,060 | $9,400 | $2,310 | $7,090 |
| 2016 | $1,201 | $10,540 | $2,570 | $7,970 |
| 2015 | $1,163 | $10,540 | $2,570 | $7,970 |
| 2014 | $1,163 | $10,540 | $2,570 | $7,970 |
| 2012 | -- | $7,470 | $3,660 | $3,810 |
Source: Public Records
Map
Nearby Homes
- 2417 Wheeler Ave
- 2212 Chamberlin Ave
- 3593 Saint James Ave
- 3748 Saint James Ave
- 2145 Kipling Dr
- 2620 N Gettysburg Ave
- 2200 Kensington Dr
- 2127 Kensington Dr
- 2150 Kensington Dr
- 4076 Prescott Ave
- 2726 Wentworth Ave
- 3801 Salem Ave
- Lot#25 Glenbrook Dr
- Lot#24 Glenbrook Dr
- Lot#1 Glenbrook Dr
- Lot#21 Glenbrook Dr
- 1954 Kensington Dr
- 3740 Kings Hwy
- 2826 W Hillcrest Ave
- 4445 Prescott Ave
- 2404 Fairport Ave
- 2416 Fairport Ave
- 3721 W Hillcrest Ave
- 3701 W Hillcrest Ave
- 2420 Fairport Ave
- 2413 Alpena Ave
- 2417 Alpena Ave
- 2424 Fairport Ave
- 2417 Fairport Ave
- 2409 Fairport Ave
- 3601 W Hillcrest Ave
- 3725 W Hillcrest Ave
- 2432 Fairport Ave
- 2421 Fairport Ave
- 3612 W Hillcrest Ave
- 3700 W Hillcrest Ave
- 2419 Alpena Ave
- 3724 W Hillcrest Ave
- 2425 Fairport Ave
- 2425 Alpena Ave