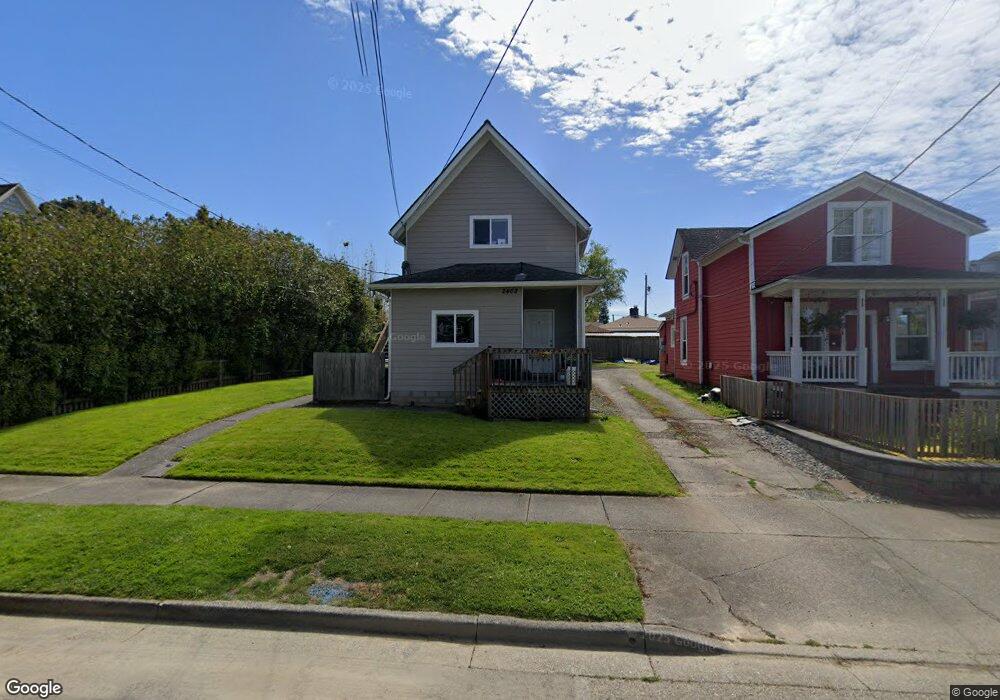
2408 J St Bellingham, WA 98225
Lettered Streets NeighborhoodEstimated Value: $651,987 - $776,000
1
Bed
3
Baths
1,858
Sq Ft
$387/Sq Ft
Est. Value
About This Home
This home is located at 2408 J St, Bellingham, WA 98225 and is currently estimated at $718,747, approximately $386 per square foot. 2408 J St is a home located in Whatcom County with nearby schools including Parkview Elementary School, Whatcom Middle School, and Bellingham High School.
Ownership History
Date
Name
Owned For
Owner Type
Purchase Details
Closed on
Apr 30, 2013
Sold by
Kipp Donald A
Bought by
2408 J Street Llc
Current Estimated Value
Home Financials for this Owner
Home Financials are based on the most recent Mortgage that was taken out on this home.
Original Mortgage
$238,000
Interest Rate
3.51%
Mortgage Type
Seller Take Back
Purchase Details
Closed on
Feb 8, 2001
Sold by
Kipp Donald A
Bought by
Kipp Donald A
Purchase Details
Closed on
Dec 29, 1976
Sold by
Bell Wayne R and Bell Esther
Bought by
Reid Duane E and Reid Gerene C
Create a Home Valuation Report for This Property
The Home Valuation Report is an in-depth analysis detailing your home's value as well as a comparison with similar homes in the area
Home Values in the Area
Average Home Value in this Area
Purchase History
| Date | Buyer | Sale Price | Title Company |
|---|---|---|---|
| 2408 J Street Llc | $253,280 | First American Title Ins | |
| Kipp Donald A | -- | -- | |
| Reid Duane E | -- | Pioneer National Title Ins |
Source: Public Records
Mortgage History
| Date | Status | Borrower | Loan Amount |
|---|---|---|---|
| Closed | 2408 J Street Llc | $238,000 |
Source: Public Records
Tax History Compared to Growth
Tax History
| Year | Tax Paid | Tax Assessment Tax Assessment Total Assessment is a certain percentage of the fair market value that is determined by local assessors to be the total taxable value of land and additions on the property. | Land | Improvement |
|---|---|---|---|---|
| 2024 | $5,087 | $637,413 | $292,486 | $344,927 |
| 2023 | $5,087 | $653,603 | $299,915 | $353,688 |
| 2022 | $4,766 | $563,461 | $258,552 | $304,909 |
| 2021 | $4,075 | $447,191 | $205,200 | $241,991 |
| 2020 | $3,442 | $414,066 | $190,000 | $224,066 |
| 2019 | $3,082 | $338,056 | $141,415 | $196,641 |
| 2018 | $3,103 | $303,456 | $126,965 | $176,491 |
| 2017 | $2,676 | $261,265 | $109,310 | $151,955 |
| 2016 | $2,342 | $235,466 | $98,090 | $137,376 |
| 2015 | $2,296 | $214,521 | $89,590 | $124,931 |
| 2014 | -- | $203,530 | $85,000 | $118,530 |
| 2013 | -- | $162,509 | $68,250 | $94,259 |
Source: Public Records
Map
Nearby Homes
- 2500 Meridian St
- 2500 Cornwall Ave
- 2600 Elm St
- 1800 J St
- 3008 Meridian St
- 2019 Cornwall Ave
- 2432 Grant St
- 1410 J St
- 3018 Elm St
- 2111 Franklin St
- 2805 Walnut St
- 1315 Astor St
- 1200 W Holly St
- 1508 E Maplewood Ave
- 2218 Jaeger St
- 2935 King St
- 1025 Granary Ave Unit 503
- 1025 Granary Ave Unit 404
- 1025 Granary Ave Unit 306
- 1025 Granary Ave Unit 506