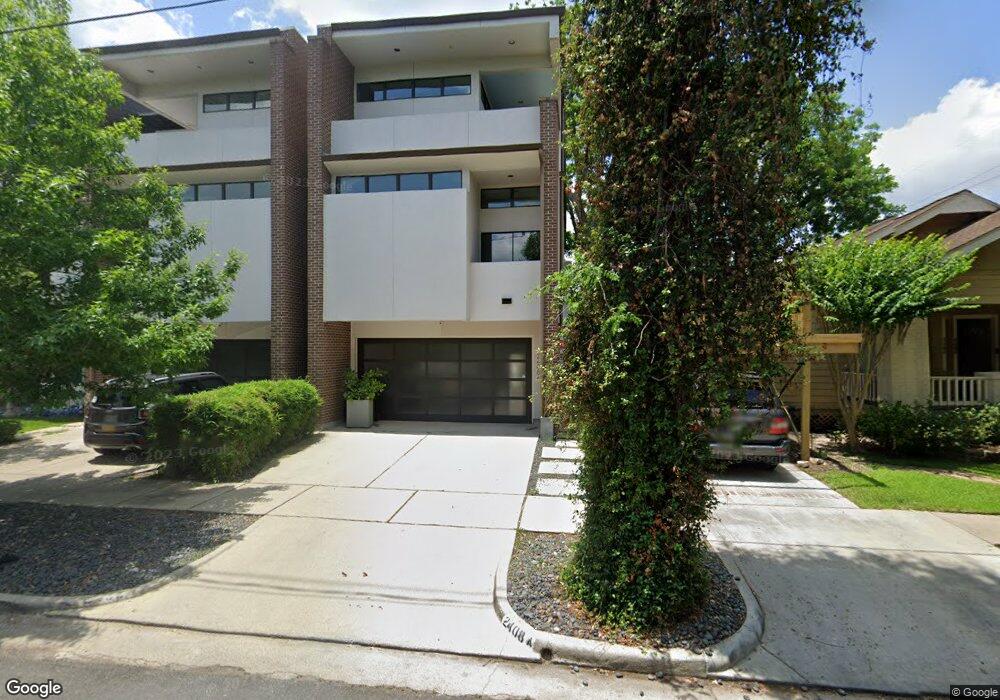
2408 Park St Unit A Houston, TX 77019
Montrose NeighborhoodEstimated Value: $830,000 - $1,168,000
4
Beds
4
Baths
3,348
Sq Ft
$301/Sq Ft
Est. Value
About This Home
This home is located at 2408 Park St Unit A, Houston, TX 77019 and is currently estimated at $1,006,599, approximately $300 per square foot. 2408 Park St Unit A is a home located in Harris County with nearby schools including Baker Montessori, Lanier Middle School, and Lamar High School.
Ownership History
Date
Name
Owned For
Owner Type
Purchase Details
Closed on
Oct 31, 2011
Sold by
On Point Custom Homes Lp
Bought by
Winningham Geoffrey L and Freeman Janice A
Current Estimated Value
Home Financials for this Owner
Home Financials are based on the most recent Mortgage that was taken out on this home.
Original Mortgage
$411,999
Outstanding Balance
$282,566
Interest Rate
4.14%
Mortgage Type
New Conventional
Estimated Equity
$724,033
Purchase Details
Closed on
Nov 15, 2004
Sold by
Oliver David W and Oliver Cheryl A
Bought by
Kaplan Reed O and Kaplan Lauren A
Purchase Details
Closed on
Jun 13, 1997
Sold by
Haynes Linda Ann
Bought by
Oliver David W and Oliver Cheryl A
Home Financials for this Owner
Home Financials are based on the most recent Mortgage that was taken out on this home.
Original Mortgage
$116,910
Interest Rate
7.98%
Create a Home Valuation Report for This Property
The Home Valuation Report is an in-depth analysis detailing your home's value as well as a comparison with similar homes in the area
Home Values in the Area
Average Home Value in this Area
Purchase History
| Date | Buyer | Sale Price | Title Company |
|---|---|---|---|
| Winningham Geoffrey L | -- | Etc | |
| Kaplan Reed O | -- | Fidelity | |
| Oliver David W | -- | Commonwealth Land Title Co |
Source: Public Records
Mortgage History
| Date | Status | Borrower | Loan Amount |
|---|---|---|---|
| Open | Winningham Geoffrey L | $411,999 | |
| Previous Owner | Oliver David W | $116,910 |
Source: Public Records
Tax History Compared to Growth
Tax History
| Year | Tax Paid | Tax Assessment Tax Assessment Total Assessment is a certain percentage of the fair market value that is determined by local assessors to be the total taxable value of land and additions on the property. | Land | Improvement |
|---|---|---|---|---|
| 2025 | $7,714 | $932,811 | $275,000 | $657,811 |
| 2024 | $7,714 | $985,800 | $275,000 | $710,800 |
| 2023 | $7,714 | $923,747 | $275,000 | $648,747 |
| 2022 | $18,258 | $833,796 | $275,000 | $558,796 |
| 2021 | $17,569 | $753,836 | $262,500 | $491,336 |
| 2020 | $17,193 | $710,000 | $262,500 | $447,500 |
| 2019 | $20,598 | $826,000 | $150,000 | $676,000 |
| 2018 | $9,882 | $740,000 | $150,000 | $590,000 |
| 2017 | $19,636 | $740,000 | $150,000 | $590,000 |
| 2016 | $18,959 | $740,000 | $150,000 | $590,000 |
| 2015 | $9,104 | $779,000 | $150,000 | $629,000 |
| 2014 | $9,104 | $863,648 | $131,250 | $732,398 |
Source: Public Records
Map
Nearby Homes
- 2415 Elmen St
- 2314 Park St
- 2413 Ralph St Unit 2
- 1660 Hawthorne St
- 2506 Mandell St Unit 3
- 1701 Hawthorne St
- 2309 Driscoll St
- 2025 Park St
- 1728 Michigan St Unit A
- 1728 Michigan St Unit C
- 2011 Woodhead St
- 1620 Harold St
- 1660 Kipling St
- 2026 Morse St
- 1709 Haver St
- 1539 Westheimer Rd
- 2505 Mcduffie St Unit B
- 1705 Michigan St
- 1900 Hawthorne St
- 2103 Hazard St