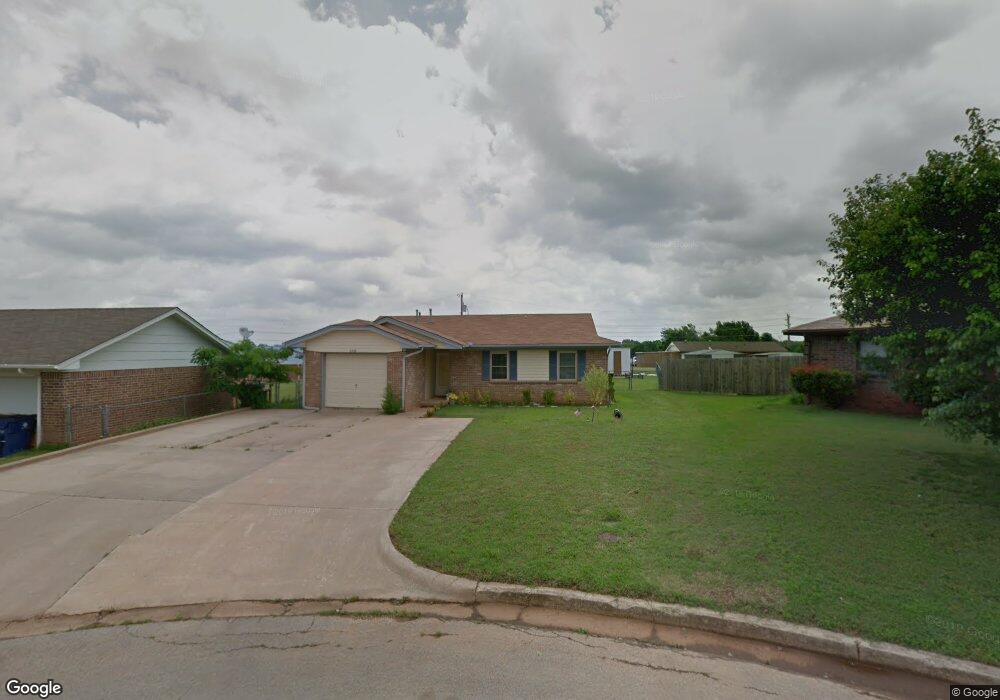
2408 S 30th St Chickasha, OK 73018
Estimated Value: $126,223 - $174,000
3
Beds
2
Baths
983
Sq Ft
$148/Sq Ft
Est. Value
About This Home
This home is located at 2408 S 30th St, Chickasha, OK 73018 and is currently estimated at $145,556, approximately $148 per square foot. 2408 S 30th St is a home located in Grady County with nearby schools including Grand Avenue Elementary School, Chickasha Middle School, and Lincoln Elementary School.
Ownership History
Date
Name
Owned For
Owner Type
Purchase Details
Closed on
Sep 12, 2017
Sold by
Moran Christine E
Bought by
Moran Brian K
Current Estimated Value
Purchase Details
Closed on
Jun 27, 2013
Sold by
Pearce Carol J
Bought by
Palesano Jennifer G
Home Financials for this Owner
Home Financials are based on the most recent Mortgage that was taken out on this home.
Original Mortgage
$81,122
Outstanding Balance
$58,029
Interest Rate
3.54%
Mortgage Type
New Conventional
Estimated Equity
$87,527
Purchase Details
Closed on
Aug 31, 2009
Sold by
Deltic Land Lp
Bought by
Jernigan John F
Purchase Details
Closed on
Jul 31, 2007
Sold by
Craig Robert O and Craig Debra J
Bought by
Pearce Carol J
Home Financials for this Owner
Home Financials are based on the most recent Mortgage that was taken out on this home.
Original Mortgage
$66,500
Interest Rate
6.64%
Mortgage Type
New Conventional
Create a Home Valuation Report for This Property
The Home Valuation Report is an in-depth analysis detailing your home's value as well as a comparison with similar homes in the area
Home Values in the Area
Average Home Value in this Area
Purchase History
| Date | Buyer | Sale Price | Title Company |
|---|---|---|---|
| Moran Brian K | -- | None Available | |
| Palesano Jennifer G | $79,500 | None Available | |
| Jernigan John F | $144,000 | None Available | |
| Pearce Carol J | $66,500 | None Available |
Source: Public Records
Mortgage History
| Date | Status | Borrower | Loan Amount |
|---|---|---|---|
| Open | Palesano Jennifer G | $81,122 | |
| Previous Owner | Pearce Carol J | $66,500 |
Source: Public Records
Tax History Compared to Growth
Tax History
| Year | Tax Paid | Tax Assessment Tax Assessment Total Assessment is a certain percentage of the fair market value that is determined by local assessors to be the total taxable value of land and additions on the property. | Land | Improvement |
|---|---|---|---|---|
| 2024 | $875 | $9,625 | $1,874 | $7,751 |
| 2023 | $875 | $9,345 | $2,010 | $7,335 |
| 2022 | $839 | $9,072 | $1,765 | $7,307 |
| 2021 | $793 | $8,892 | $1,428 | $7,464 |
| 2020 | $840 | $9,162 | $1,428 | $7,734 |
| 2019 | $832 | $9,233 | $1,428 | $7,805 |
| 2018 | $874 | $9,487 | $1,428 | $8,059 |
| 2017 | $850 | $9,211 | $1,428 | $7,783 |
| 2016 | $848 | $9,121 | $1,124 | $7,997 |
| 2015 | $811 | $9,007 | $1,091 | $7,916 |
| 2014 | $811 | $8,745 | $956 | $7,789 |
Source: Public Records
Map
Nearby Homes
- 2412 S 30th St
- 2801 S 27th Ct
- 2808 Scissortail Dr
- 2401 S 28th Terrace
- 2328 S 27th Ct
- 2329 S 27th Ct
- 2805 S 27th Ct
- 2812 Scissortail Dr
- 2825 S 27th Ct
- 2821 S 27th Ct
- 2325 S 27th Ct
- 2400 S 27th Ct
- 2817 S 27th Ct
- 2329 S 28th Terrace
- 2409 S 27th Ct
- 2325 S 28th Terrace
- 3208 California Ave
- 3400 W Mississippi Ave
- 2210 Lakewood Dr
- 2305 Lakewood Dr
- 2406 S 30th St
- 2410 S 30th St
- 2404 S 30th St
- 3008 W Montana Ave
- 3001 W Montana Ave
- 2402 S 30th St
- 3010 W Montana Ave
- 3003 W Montana Ave
- 2420 S 29th St
- 3 Skyview Dr
- 3003 Arizona Ave
- 3012 W Montana Ave
- 2 Skyview Dr
- 3005 W Montana Ave
- 4 Skyview Dr
- 3014 W Montana Ave
- 3007 W Montana Ave
- 5 Skyview Dr
- 404 Pikes Peak Rd
- 2305 S 30th St