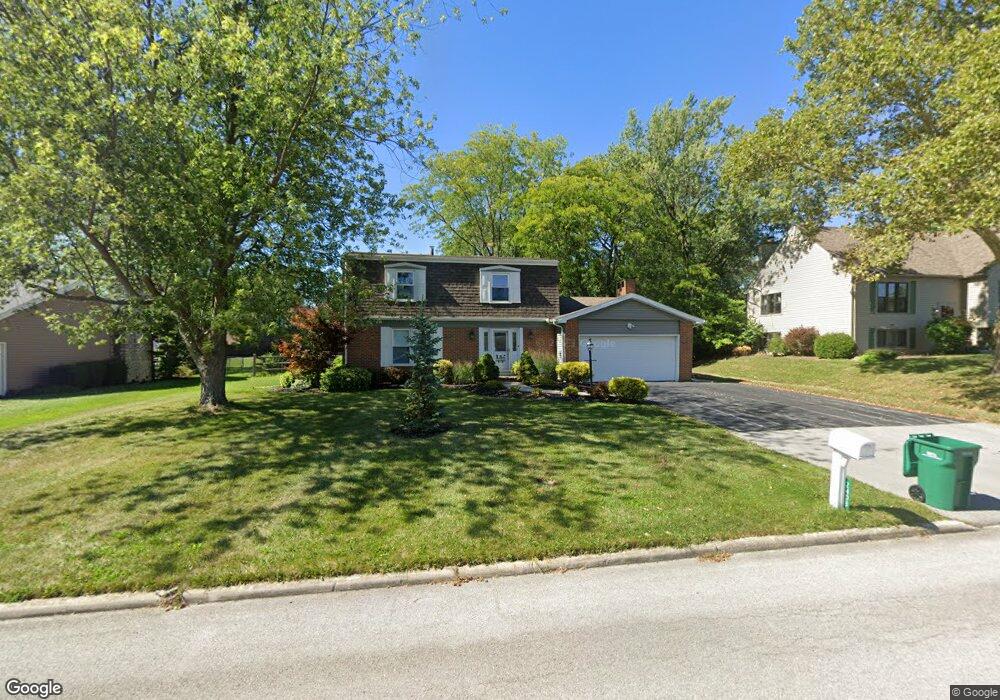
2408 Westmoor Rd Findlay, OH 45840
Estimated Value: $212,000 - $298,000
4
Beds
3
Baths
1,956
Sq Ft
$140/Sq Ft
Est. Value
About This Home
This home is located at 2408 Westmoor Rd, Findlay, OH 45840 and is currently estimated at $273,549, approximately $139 per square foot. 2408 Westmoor Rd is a home located in Hancock County with nearby schools including Bigelow Hill Elementary School, Northview Elementary School, and Glenwood Middle School.
Ownership History
Date
Name
Owned For
Owner Type
Purchase Details
Closed on
Feb 17, 2022
Sold by
Heldman Michael E
Bought by
Crom John J and Crom Jeannie M
Current Estimated Value
Purchase Details
Closed on
Jun 19, 2001
Sold by
Trst Gerald E Ice
Bought by
Crom John J and Jeannie Crom M
Home Financials for this Owner
Home Financials are based on the most recent Mortgage that was taken out on this home.
Original Mortgage
$133,980
Interest Rate
7.16%
Mortgage Type
FHA
Purchase Details
Closed on
Oct 12, 1993
Bought by
Ice Gerald E and Ice Ellen
Create a Home Valuation Report for This Property
The Home Valuation Report is an in-depth analysis detailing your home's value as well as a comparison with similar homes in the area
Home Values in the Area
Average Home Value in this Area
Purchase History
| Date | Buyer | Sale Price | Title Company |
|---|---|---|---|
| Crom John J | $158,000 | None Listed On Document | |
| Crom John J | $136,600 | -- | |
| Ice Gerald E | -- | -- |
Source: Public Records
Mortgage History
| Date | Status | Borrower | Loan Amount |
|---|---|---|---|
| Previous Owner | Crom John J | $133,980 |
Source: Public Records
Tax History Compared to Growth
Tax History
| Year | Tax Paid | Tax Assessment Tax Assessment Total Assessment is a certain percentage of the fair market value that is determined by local assessors to be the total taxable value of land and additions on the property. | Land | Improvement |
|---|---|---|---|---|
| 2024 | $2,721 | $75,030 | $11,070 | $63,960 |
| 2023 | $2,725 | $75,030 | $11,070 | $63,960 |
| 2022 | $2,723 | $75,030 | $11,070 | $63,960 |
| 2021 | $2,490 | $59,860 | $11,060 | $48,800 |
| 2020 | $2,490 | $59,860 | $11,060 | $48,800 |
| 2019 | $2,630 | $59,860 | $11,060 | $48,800 |
| 2018 | $2,367 | $49,510 | $8,840 | $40,670 |
| 2017 | $2,153 | $49,510 | $8,840 | $40,670 |
| 2016 | $2,123 | $49,510 | $8,840 | $40,670 |
| 2015 | $2,210 | $50,540 | $8,840 | $41,700 |
| 2014 | $2,193 | $50,140 | $8,840 | $41,300 |
| 2012 | $2,208 | $50,140 | $8,840 | $41,300 |
Source: Public Records
Map
Nearby Homes
- 933 Laurel Ln
- 905 W Melrose Ave
- 925 W Melrose Ave
- 643 Edith Ave
- 1310 Muirfield Dr
- 3018 Gleneagle Dr
- 615 Hillcrest Ave
- 506 Hillcrest Ave
- 3106 Saddlebrook
- 1405 Cypress Lake
- 304 Prentiss Ave
- 6535 Silver Lake Dr
- 3300 Crosshill Dr
- 304 Rector Ave
- 405 Clifton Ave
- 232 Prentiss Ave
- 410 Monroe Ave
- 1934 Geffs Ave
- 0 County Road 223
- 126 Hillcrest Ave
- 2412 Westmoor Rd
- 2404 Westmoor Rd
- 2409 Sweetwater Rd
- 2415 Sweetwater Rd
- 2405 Sweetwater Rd
- 2501 Sweetwater Rd
- 2416 Westmoor Rd
- 2401 Sweetwater Rd
- 2413 Westmoor Rd
- 2409 Westmoor Rd
- 2507 Sweetwater Rd
- 2417 Westmoor Rd
- 2405 Westmoor Rd
- 2420 Westmoor Rd
- 2421 Westmoor Rd
- 2513 Sweetwater Rd
- 2412 Sweetwater Rd
- 2500 Westmoor Rd
- 2416 Sweetwater Rd
- 2412 Springmill Rd