2409 21st St SE Puyallup, WA 98374
Estimated Value: $451,000 - $469,000
3
Beds
1
Bath
1,100
Sq Ft
$417/Sq Ft
Est. Value
About This Home
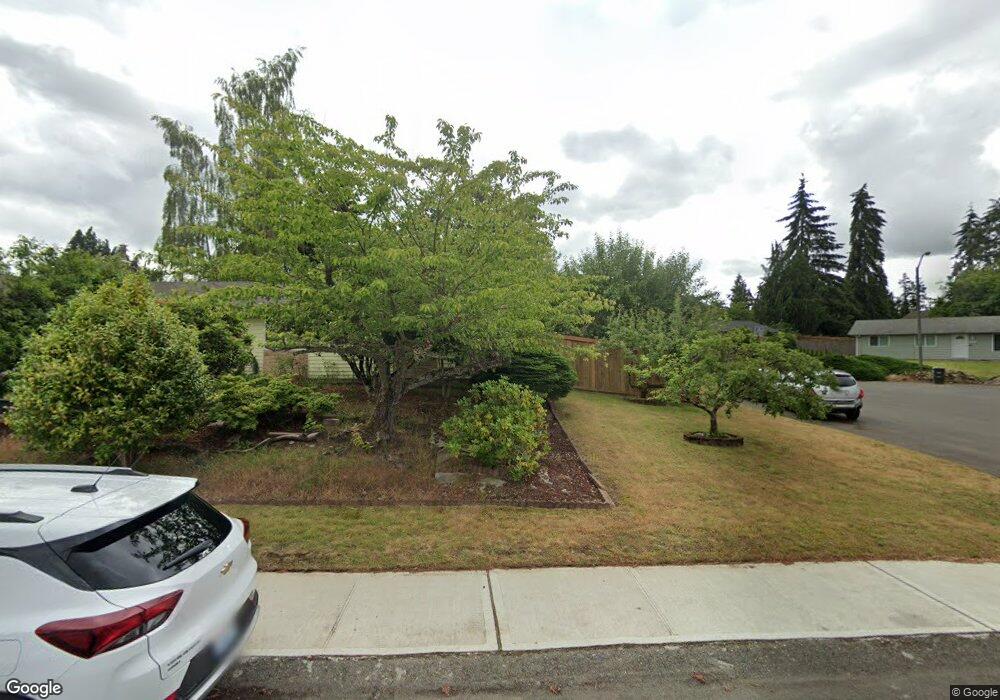
This home is located at 2409 21st St SE, Puyallup, WA 98374 and is currently estimated at $458,770, approximately $417 per square foot. 2409 21st St SE is a home located in Pierce County with nearby schools including Wildwood Elementary School, Ferrucci Junior High School, and Emerald Ridge High School.
Ownership History
Date
Name
Owned For
Owner Type
Purchase Details
Closed on
Jul 10, 2018
Sold by
Mitchell Angela Dawn
Bought by
Mitchell Christopher Charles and Mitchell Angela Dawn
Current Estimated Value
Purchase Details
Closed on
Jan 15, 2002
Sold by
Garza Jon C and Garza Emily J
Bought by
Enyeart Angela D
Home Financials for this Owner
Home Financials are based on the most recent Mortgage that was taken out on this home.
Original Mortgage
$134,883
Outstanding Balance
$54,335
Interest Rate
6.84%
Mortgage Type
FHA
Estimated Equity
$404,435
Purchase Details
Closed on
May 22, 1997
Sold by
Mccollum Douglas A and Mccollum Sandra M
Bought by
Garza Jon C
Home Financials for this Owner
Home Financials are based on the most recent Mortgage that was taken out on this home.
Original Mortgage
$104,857
Interest Rate
8.13%
Mortgage Type
FHA
Create a Home Valuation Report for This Property
The Home Valuation Report is an in-depth analysis detailing your home's value as well as a comparison with similar homes in the area
Home Values in the Area
Average Home Value in this Area
Purchase History
| Date | Buyer | Sale Price | Title Company |
|---|---|---|---|
| Mitchell Christopher Charles | -- | None Available | |
| Enyeart Angela D | $159,385 | Chicago Title | |
| Garza Jon C | $105,750 | Transnation Title Insurance | |
| Garza Jon C | -- | Transnation Title Insurance |
Source: Public Records
Mortgage History
| Date | Status | Borrower | Loan Amount |
|---|---|---|---|
| Open | Enyeart Angela D | $134,883 | |
| Previous Owner | Garza Jon C | $104,857 |
Source: Public Records
Tax History Compared to Growth
Tax History
| Year | Tax Paid | Tax Assessment Tax Assessment Total Assessment is a certain percentage of the fair market value that is determined by local assessors to be the total taxable value of land and additions on the property. | Land | Improvement |
|---|---|---|---|---|
| 2025 | $3,614 | $388,000 | $197,000 | $191,000 |
| 2024 | $3,614 | $391,400 | $191,900 | $199,500 |
| 2023 | $3,614 | $364,200 | $184,300 | $179,900 |
| 2022 | $3,571 | $367,500 | $188,100 | $179,400 |
| 2021 | $3,322 | $275,100 | $131,700 | $143,400 |
| 2019 | $2,793 | $251,300 | $113,300 | $138,000 |
| 2018 | $2,737 | $227,900 | $104,100 | $123,800 |
| 2017 | $2,522 | $197,600 | $88,800 | $108,800 |
| 2016 | $2,198 | $151,700 | $71,000 | $80,700 |
| 2014 | $1,964 | $144,300 | $64,100 | $80,200 |
| 2013 | $1,964 | $129,000 | $56,100 | $72,900 |
Source: Public Records
Map
Nearby Homes
- 2011 25th Ave SE
- 2503 25th St SE
- 2202 28th Ave SE
- 2117 22nd St SE
- 2611 26th Ave SE
- 1605 27th Ave SE
- 2804 18th St SE
- 2804 25th Avenue Ct SE
- 1809 31st Ave SE
- 2905 16th St SE
- 2810 Cherokee Blvd
- 2302 29th Street Place SE
- 1835 Brookmonte Dr SE
- 1803 Brookmonte Dr SE
- 1810 Brookmonte Dr SE
- 2921 Forest Rim Ct S
- 2927 Forest Rim Ct S
- 1812 28th St SE
- 2622 31st Street Ct SE
- 2702 17th Ave SE
- 2407 21st St SE
- 2411 21st St SE
- 2403 21st St SE
- 2405 21st St SE
- 2413 21st St SE
- 2410 22nd St SE
- 2412 22nd St SE
- 2408 22nd St SE
- 2415 21st St SE
- 2408 21st St SE
- 2410 21st St SE
- 2111 25th Ave SE
- 2406 21st St SE
- 2406 22nd St SE
- 2401 21st St SE
- 2412 21st St SE
- 2105 25th Ave SE
- 2404 21st St SE
- 2404 22nd St SE
- 2414 21st St SE