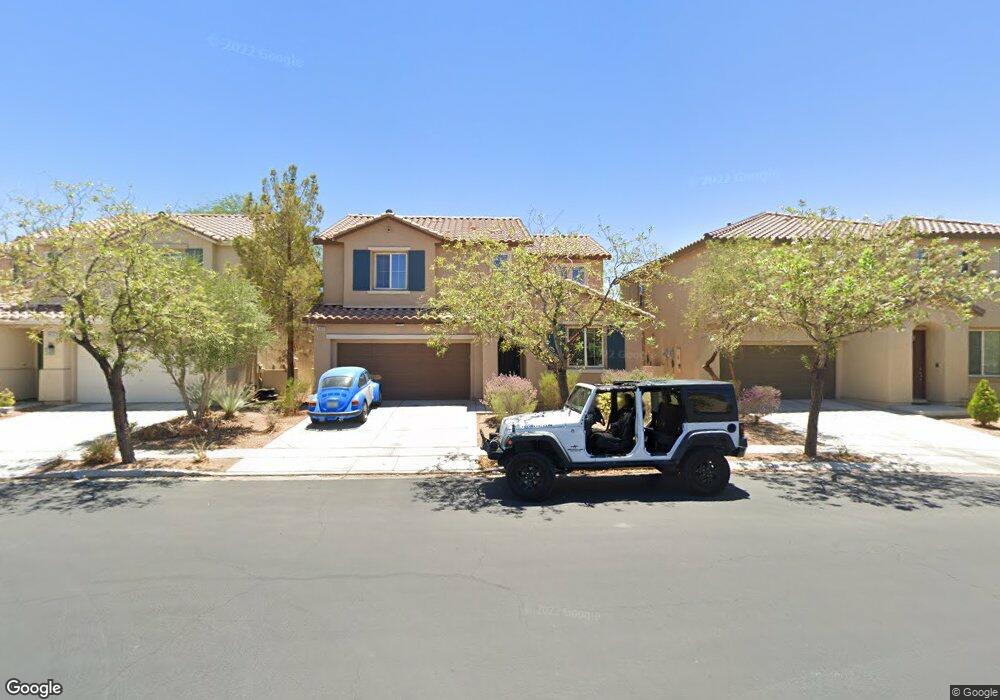
2409 Clarington Ave North Las Vegas, NV 89081
Northridge NeighborhoodEstimated Value: $379,620 - $393,000
2
Beds
3
Baths
1,657
Sq Ft
$234/Sq Ft
Est. Value
About This Home
This home is located at 2409 Clarington Ave, North Las Vegas, NV 89081 and is currently estimated at $387,405, approximately $233 per square foot. 2409 Clarington Ave is a home with nearby schools including Jesse D. Scott Elementary School, Clifford O. Findlay Middle School, and Mojave High School.
Ownership History
Date
Name
Owned For
Owner Type
Purchase Details
Closed on
May 15, 2020
Sold by
Davis John P and Davis John Parker
Bought by
Davis John Parker
Current Estimated Value
Home Financials for this Owner
Home Financials are based on the most recent Mortgage that was taken out on this home.
Original Mortgage
$130,743
Outstanding Balance
$115,856
Interest Rate
3.3%
Mortgage Type
VA
Estimated Equity
$271,549
Purchase Details
Closed on
Dec 10, 2012
Sold by
English Amy Jae
Bought by
Davis John P
Home Financials for this Owner
Home Financials are based on the most recent Mortgage that was taken out on this home.
Original Mortgage
$148,780
Interest Rate
3.36%
Mortgage Type
VA
Purchase Details
Closed on
Dec 7, 2012
Sold by
461 Harmony
Bought by
Davis John P
Home Financials for this Owner
Home Financials are based on the most recent Mortgage that was taken out on this home.
Original Mortgage
$148,780
Interest Rate
3.36%
Mortgage Type
VA
Create a Home Valuation Report for This Property
The Home Valuation Report is an in-depth analysis detailing your home's value as well as a comparison with similar homes in the area
Home Values in the Area
Average Home Value in this Area
Purchase History
| Date | Buyer | Sale Price | Title Company |
|---|---|---|---|
| Davis John Parker | -- | Lawyers Title Las Vegas | |
| Davis John P | -- | Nevada Title Las Vegas | |
| Davis John P | $148,780 | Nevada Title Las Vegas |
Source: Public Records
Mortgage History
| Date | Status | Borrower | Loan Amount |
|---|---|---|---|
| Open | Davis John Parker | $130,743 | |
| Closed | Davis John P | $148,780 |
Source: Public Records
Tax History Compared to Growth
Tax History
| Year | Tax Paid | Tax Assessment Tax Assessment Total Assessment is a certain percentage of the fair market value that is determined by local assessors to be the total taxable value of land and additions on the property. | Land | Improvement |
|---|---|---|---|---|
| 2025 | $968 | $115,470 | $29,050 | $86,420 |
| 2024 | $960 | $115,470 | $29,050 | $86,420 |
| 2023 | $960 | $111,805 | $30,800 | $81,005 |
| 2022 | $1,006 | $97,292 | $23,450 | $73,842 |
| 2021 | $969 | $89,865 | $21,350 | $68,515 |
| 2020 | $986 | $90,771 | $23,100 | $67,671 |
| 2019 | $933 | $83,734 | $17,500 | $66,234 |
| 2018 | $697 | $71,049 | $14,000 | $57,049 |
| 2017 | $1,711 | $59,908 | $12,250 | $47,658 |
| 2016 | $770 | $52,733 | $8,750 | $43,983 |
| 2015 | $478 | $37,077 | $8,050 | $29,027 |
| 2014 | $1,068 | $5,600 | $5,600 | $0 |
Source: Public Records
Map
Nearby Homes
- 2117 Leatherbridge Ct
- 5440 Aladdin Dream St
- 5436 Aladdin Dream St
- 1817 Cosmo Star Ave
- 1808 Luxor Lights Ave
- 5253 Pendergrass St
- 5685 Colbert St
- 5712 Nobleton Ct
- 5217 Grand Lake St
- 5614 Midnight Breeze St
- 5605 Midnight Breeze St
- 5630 Midnight Breeze St
- 5713 Lawrence St
- 1602 Morning Bell Ave
- 5737 Fleming St
- 2809 Kandahar Ave
- 5116 Blue Rose St
- 5528 Oatfield St
- 2608 Campobello Ave
- 2813 White Peaks Ave
- 2405 Clarington Ave
- 2413 Clarington Ave
- 2412 Briggsdale Ave
- 2408 Briggsdale Ave
- 2321 Clarington Ave
- 2328 Briggsdale Ave
- 2416 Briggsdale Ave
- 2417 Clarington Ave
- 2324 Briggsdale Ave
- 2317 Clarington Ave
- 2420 Briggsdale Ave
- 2320 Briggsdale Ave
- 2320 Clarington Ave
- 2332 Briggsdale Ave
- 2424 Briggsdale Ave
- 5449 Tallulah Falls St
- 2313 Clarington Ave
- 5448 Tallulah Falls St
- 5444 Ayers Cliff St
- 2316 Briggsdale Ave