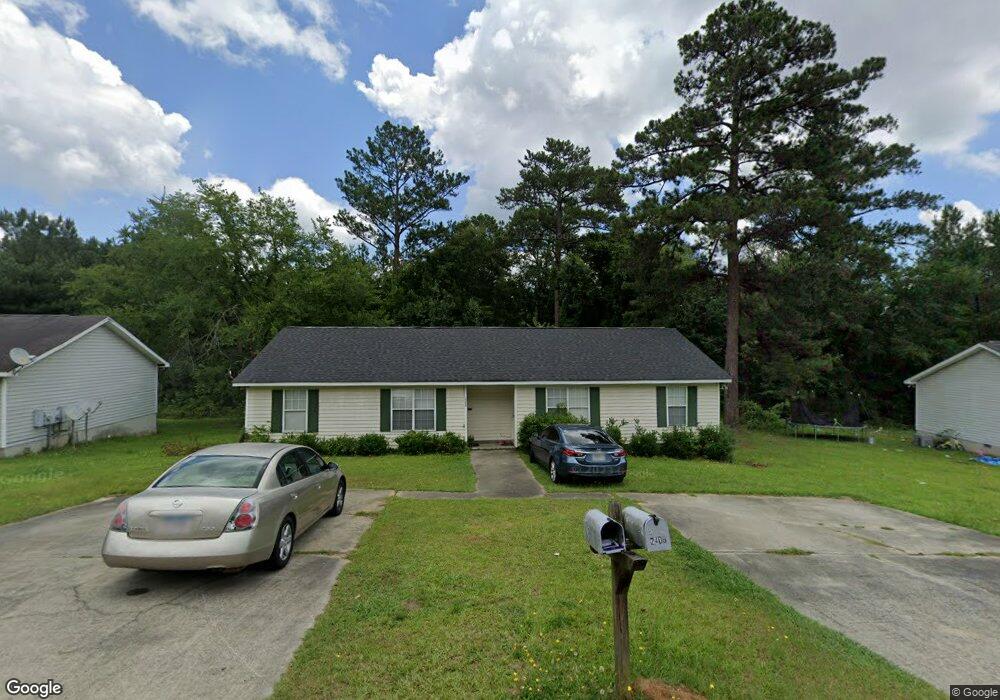
2409 Grandview Ct NE Milledgeville, GA 31061
Estimated Value: $128,000 - $196,000
4
Beds
2
Baths
1,656
Sq Ft
$101/Sq Ft
Est. Value
About This Home
This home is located at 2409 Grandview Ct NE, Milledgeville, GA 31061 and is currently estimated at $166,979, approximately $100 per square foot. 2409 Grandview Ct NE is a home located in Baldwin County with nearby schools including Lakeview Primary, Lakeview Academy, and Oak Hill Middle School.
Ownership History
Date
Name
Owned For
Owner Type
Purchase Details
Closed on
Oct 13, 2011
Sold by
Malone Scott A
Bought by
Giles Gordon R
Current Estimated Value
Purchase Details
Closed on
Aug 8, 2006
Sold by
Enterpris Mcquaig Brothers
Bought by
Malone Scott A
Home Financials for this Owner
Home Financials are based on the most recent Mortgage that was taken out on this home.
Original Mortgage
$77,456
Interest Rate
6.67%
Mortgage Type
New Conventional
Purchase Details
Closed on
Feb 1, 2004
Sold by
The Don Charles Wach Co
Bought by
Mcquaig Brothers Enterprises
Purchase Details
Closed on
Aug 14, 2003
Sold by
Hodell Thomas
Bought by
The Don Charles Wach Co
Purchase Details
Closed on
Jul 23, 1999
Sold by
Hodell Thomas
Bought by
Hodell Thomas
Purchase Details
Closed on
Feb 11, 1999
Sold by
Hodell Thomas
Bought by
Hodell Thomas
Purchase Details
Closed on
Feb 26, 1996
Sold by
Eady and Craig
Bought by
Hodell Thomas
Create a Home Valuation Report for This Property
The Home Valuation Report is an in-depth analysis detailing your home's value as well as a comparison with similar homes in the area
Home Values in the Area
Average Home Value in this Area
Purchase History
| Date | Buyer | Sale Price | Title Company |
|---|---|---|---|
| Giles Gordon R | $50,000 | -- | |
| Malone Scott A | $96,820 | -- | |
| Mcquaig Brothers Enterprises | $290,800 | -- | |
| The Don Charles Wach Co | $265,000 | -- | |
| Hodell Thomas | -- | -- | |
| Hodell Thomas | -- | -- | |
| Hodell Thomas | $9,000 | -- |
Source: Public Records
Mortgage History
| Date | Status | Borrower | Loan Amount |
|---|---|---|---|
| Previous Owner | Malone Scott A | $77,456 | |
| Previous Owner | Malone Scott A | $19,364 |
Source: Public Records
Tax History Compared to Growth
Tax History
| Year | Tax Paid | Tax Assessment Tax Assessment Total Assessment is a certain percentage of the fair market value that is determined by local assessors to be the total taxable value of land and additions on the property. | Land | Improvement |
|---|---|---|---|---|
| 2025 | $1,332 | $37,376 | $4,376 | $33,000 |
| 2024 | $1,332 | $37,376 | $4,376 | $33,000 |
| 2023 | $615 | $24,000 | $3,600 | $20,400 |
| 2022 | $610 | $24,000 | $3,600 | $20,400 |
| 2021 | $588 | $21,840 | $3,640 | $18,200 |
| 2020 | $580 | $21,840 | $3,640 | $18,200 |
| 2019 | $581 | $21,840 | $3,640 | $18,200 |
| 2018 | $589 | $21,840 | $3,640 | $18,200 |
| 2017 | $825 | $38,080 | $3,640 | $34,440 |
| 2016 | $506 | $18,800 | $3,040 | $15,760 |
| 2015 | $507 | $18,800 | $3,040 | $15,760 |
| 2014 | $508 | $18,800 | $3,040 | $15,760 |
Source: Public Records
Map
Nearby Homes
- 2401 River Ridge Rd NE
- 2361 River Ridge Rd NE
- 2313 Laura Ct NE
- 2317 Laura Ct NE
- 4000 Jeffery Way NE
- 3674 Sussex Dr NE
- 4004 Jeffrey Way
- 4004 Jeffery Way NE
- 3683 Sussex Ct NE
- 122 Ivey Weaver Rd NE
- 3638 Sussex Dr NE
- 3715 Sinclair Dam Rd NE
- 2090 N Jefferson St NE
- 2128 N Jefferson St NE
- 1985 Briarcliff Rd
- 1985 Briarcliff Rd Unit A1
- 1985 Briarcliff Rd Unit B1
- 140 Silver Birch Ln NE
- 1647 Valley Rd
- 1756 Stone Meadow Rd
- 2411 Grandview Ct NE
- 2411 Grandview Dr NE
- 2407 Grandview Ct NE
- 2407 Grandview Dr NE
- 2419 Grandview Ct NE
- 2419 Grandview Dr NE
- 2408 Grandview Ct NE
- 2410 Grandview Ct NE
- 0 Grandview Ct
- 2406 Grandview Ct NE
- 2405 Grandview Ct NE
- 2412 River Ridge Rd NE
- 2416 Grandview Dr NE
- 2416 Grandview Ct NE
- 2416 River Ridge Rd NE
- 2420 River Ridge Rd NE
- 2421 Grandview Ct NE
- 2422 Grandview Ct NE
- 2424 River Ridge Rd NE
- 2418 Grandview Ct NE