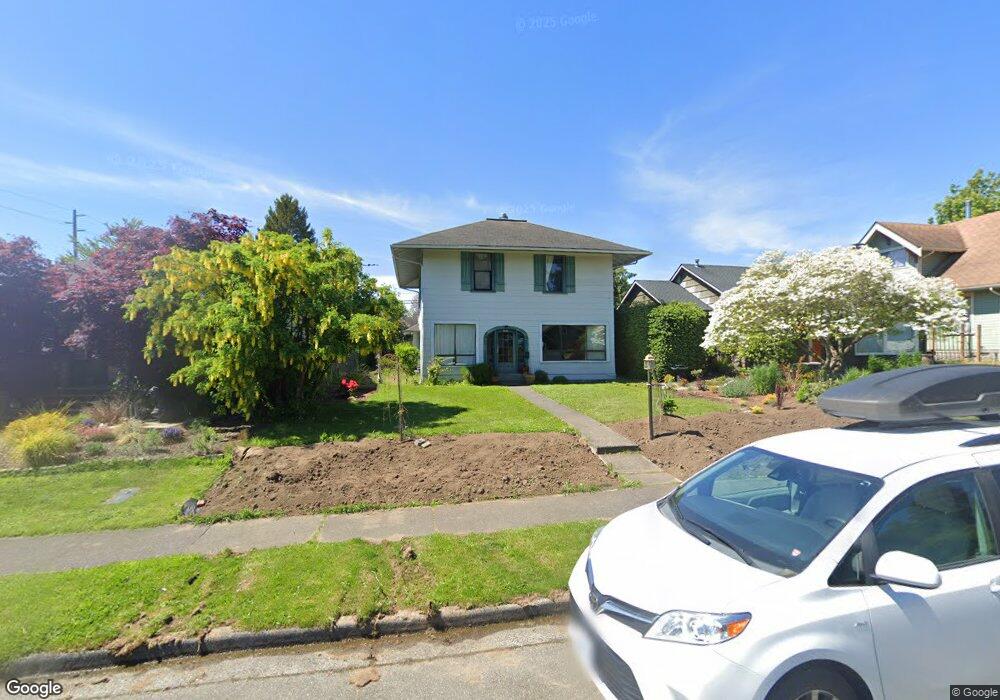
2409 Grant St Bellingham, WA 98225
Sunnyland NeighborhoodEstimated Value: $642,000 - $856,000
5
Beds
2
Baths
2,104
Sq Ft
$342/Sq Ft
Est. Value
About This Home
This home is located at 2409 Grant St, Bellingham, WA 98225 and is currently estimated at $718,526, approximately $341 per square foot. 2409 Grant St is a home located in Whatcom County with nearby schools including Sunnyland Elementary School, Whatcom Middle School, and Bellingham High School.
Ownership History
Date
Name
Owned For
Owner Type
Purchase Details
Closed on
Sep 15, 2022
Sold by
2409 Grant St Llc
Bought by
Carrington Malarie Jean and Rova Daniel Michael
Current Estimated Value
Home Financials for this Owner
Home Financials are based on the most recent Mortgage that was taken out on this home.
Original Mortgage
$498,600
Outstanding Balance
$475,892
Interest Rate
5.13%
Mortgage Type
New Conventional
Estimated Equity
$242,634
Purchase Details
Closed on
Jun 9, 2016
Sold by
Corrington Jesse
Bought by
2409 Grant St Llc
Purchase Details
Closed on
Nov 25, 2013
Sold by
Corrington Jesse and Corrington Malarie J
Bought by
Corrington Jesse
Purchase Details
Closed on
Sep 29, 2011
Sold by
Anderson Steven Michael and Anderson Marla Jane
Bought by
Corrington Jesse and Corrington Malarie
Home Financials for this Owner
Home Financials are based on the most recent Mortgage that was taken out on this home.
Original Mortgage
$224,000
Interest Rate
4.09%
Mortgage Type
New Conventional
Create a Home Valuation Report for This Property
The Home Valuation Report is an in-depth analysis detailing your home's value as well as a comparison with similar homes in the area
Home Values in the Area
Average Home Value in this Area
Purchase History
| Date | Buyer | Sale Price | Title Company |
|---|---|---|---|
| Carrington Malarie Jean | -- | New Title Company Name | |
| 2409 Grant St Llc | -- | None Available | |
| Corrington Jesse | -- | None Available | |
| Corrington Jesse | $280,280 | Stewart Title Company |
Source: Public Records
Mortgage History
| Date | Status | Borrower | Loan Amount |
|---|---|---|---|
| Open | Carrington Malarie Jean | $498,600 | |
| Previous Owner | Corrington Jesse | $224,000 |
Source: Public Records
Tax History Compared to Growth
Tax History
| Year | Tax Paid | Tax Assessment Tax Assessment Total Assessment is a certain percentage of the fair market value that is determined by local assessors to be the total taxable value of land and additions on the property. | Land | Improvement |
|---|---|---|---|---|
| 2024 | $5,159 | $646,408 | $246,304 | $400,104 |
| 2023 | $5,159 | $662,826 | $252,560 | $410,266 |
| 2022 | $4,212 | $571,412 | $217,728 | $353,684 |
| 2021 | $4,133 | $453,502 | $172,800 | $280,702 |
| 2020 | $4,108 | $419,909 | $160,000 | $259,909 |
| 2019 | $3,678 | $403,493 | $143,078 | $260,415 |
| 2018 | $3,704 | $362,188 | $128,458 | $233,730 |
| 2017 | $3,196 | $311,833 | $110,596 | $201,237 |
| 2016 | $2,796 | $281,173 | $99,244 | $181,929 |
| 2015 | $2,741 | $256,091 | $90,644 | $165,447 |
| 2014 | -- | $242,971 | $86,000 | $156,971 |
| 2013 | -- | $230,208 | $78,750 | $151,458 |
Source: Public Records
Map
Nearby Homes
- 2411 Grant St
- 2401 Grant St
- 2415 2417 Grant St
- 2415 Grant St
- 2400 Franklin St
- 2412 Franklin St
- 2419 Grant St
- 2416 Franklin St
- 2400 Grant St
- 2335 Grant St
- 2418 Franklin St
- 2425 Grant St
- 2410 Grant St
- 2422 Franklin St
- 2336 Franklin St
- 2412 Grant St
- 509 Texas St
- 2416 Grant St
- 2424 Franklin St
- 2332 Franklin St