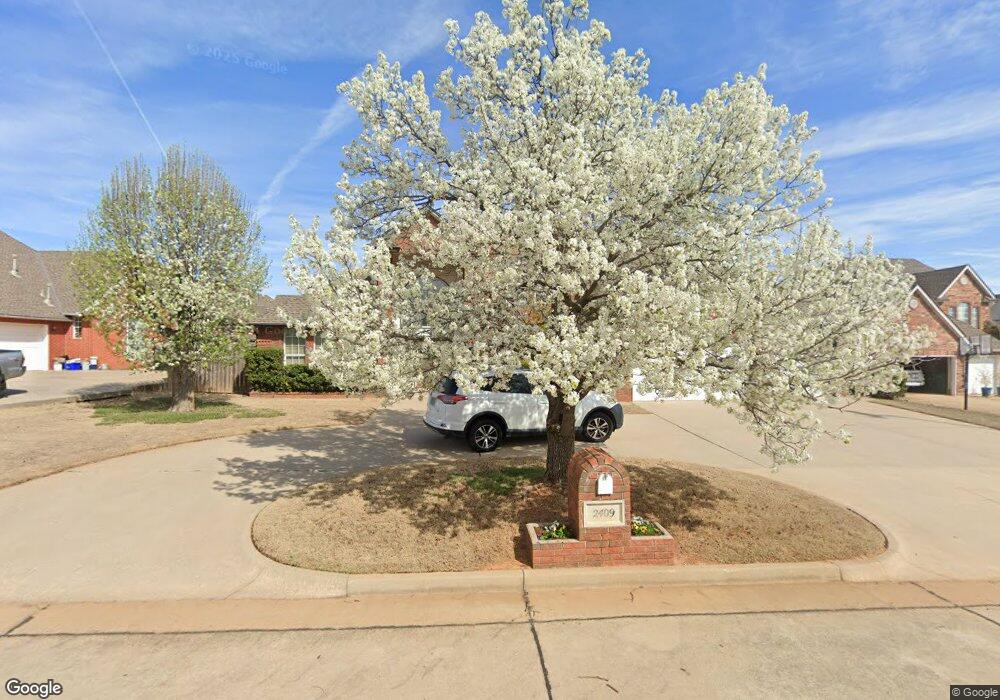
2409 Monte Cavallo Cir Oklahoma City, OK 73170
Lakeridge Run NeighborhoodEstimated Value: $390,088 - $415,000
3
Beds
4
Baths
2,930
Sq Ft
$137/Sq Ft
Est. Value
About This Home
This home is located at 2409 Monte Cavallo Cir, Oklahoma City, OK 73170 and is currently estimated at $401,022, approximately $136 per square foot. 2409 Monte Cavallo Cir is a home located in Cleveland County with nearby schools including Fisher Elementary School, Brink Junior High School, and Westmoore High School.
Ownership History
Date
Name
Owned For
Owner Type
Purchase Details
Closed on
Aug 15, 2021
Sold by
Tran Long H and Bui Thao Thach
Bought by
Tran Phieu Cam and Tran Tracy
Current Estimated Value
Home Financials for this Owner
Home Financials are based on the most recent Mortgage that was taken out on this home.
Original Mortgage
$269,600
Outstanding Balance
$52,394
Interest Rate
2.9%
Mortgage Type
Commercial
Estimated Equity
$348,629
Purchase Details
Closed on
Oct 27, 2015
Sold by
Dizani Debra Kay and Dizani Debra Kay
Bought by
Tran Long H
Home Financials for this Owner
Home Financials are based on the most recent Mortgage that was taken out on this home.
Original Mortgage
$229,500
Interest Rate
3.96%
Mortgage Type
New Conventional
Purchase Details
Closed on
May 28, 2015
Sold by
Tull Hollis
Bought by
Ali & Debra Dizani Living Trust
Purchase Details
Closed on
Aug 30, 2002
Sold by
Chilcoat Marka T and Chilcoat Deborah J
Bought by
Tull Hollis
Create a Home Valuation Report for This Property
The Home Valuation Report is an in-depth analysis detailing your home's value as well as a comparison with similar homes in the area
Home Values in the Area
Average Home Value in this Area
Purchase History
| Date | Buyer | Sale Price | Title Company |
|---|---|---|---|
| Tran Phieu Cam | $320,000 | Oklahoma City Abstract & Ttl | |
| Tran Long H | $255,000 | Oklahoma City Abstract | |
| Ali & Debra Dizani Living Trust | $275,078 | None Available | |
| Tull Hollis | $235,000 | -- |
Source: Public Records
Mortgage History
| Date | Status | Borrower | Loan Amount |
|---|---|---|---|
| Open | Tran Phieu Cam | $269,600 | |
| Previous Owner | Tran Long H | $229,500 |
Source: Public Records
Tax History Compared to Growth
Tax History
| Year | Tax Paid | Tax Assessment Tax Assessment Total Assessment is a certain percentage of the fair market value that is determined by local assessors to be the total taxable value of land and additions on the property. | Land | Improvement |
|---|---|---|---|---|
| 2024 | $4,793 | $40,376 | $7,566 | $32,810 |
| 2023 | $4,670 | $39,200 | $6,420 | $32,780 |
| 2022 | $4,590 | $38,058 | $6,296 | $31,762 |
| 2021 | $3,472 | $29,094 | $5,169 | $23,925 |
| 2020 | $3,380 | $28,246 | $3,600 | $24,646 |
| 2019 | $3,419 | $28,246 | $3,600 | $24,646 |
| 2018 | $3,459 | $28,247 | $3,600 | $24,647 |
| 2017 | $3,462 | $28,247 | $0 | $0 |
| 2016 | $3,498 | $28,247 | $3,600 | $24,647 |
| 2015 | $3,149 | $26,553 | $3,353 | $23,200 |
| 2014 | $3,050 | $25,289 | $2,916 | $22,373 |
Source: Public Records
Map
Nearby Homes
- 2608 SW 107th St
- 2309 SW 105th Ct
- 2109 Tuttington
- 2208 Amber Rd
- 2109 Kingswood Cir
- 10924 Abbeywood
- 11321 Fountain Blvd
- 2613 SW 112th St
- 11604 Gateshead Dr
- 11433 Lakeridge Run
- 11309 Greenbriar Chase
- 2705 SW 113th St
- 10202 Shadowview Dr
- 11452 Lakeridge Run
- 10825 Servon Dr
- 10817 Servon Dr
- 10809 Servon Dr
- 10801 Servon Dr
- 10733 Servon Dr
- 10725 Servon Dr
- 2405 Monte Cavallo Cir
- 2413 Monte Cavallo Cir
- 2408 Villa Lante Cir
- 2404 Villa Lante Cir
- 10800 Fountain Blvd
- 2408 Monte Cavallo Cir
- 2412 Monte Cavallo Cir
- 2401 Monte Cavallo Cir
- 2404 Monte Cavallo Cir
- 2400 Villa Lante Cir
- 2400 Monte Cavallo Cir
- 10805 Fountain Blvd
- 10809 Fountain Blvd
- 10813 Fountain Blvd
- 2409 Villa Lante Cir
- 2409 Pantheon Cir
- 10801 Fountain Blvd
- 2413 Pantheon Cir
- 2413 Villa Lante Cir
- 2401 Villa Lante Cir