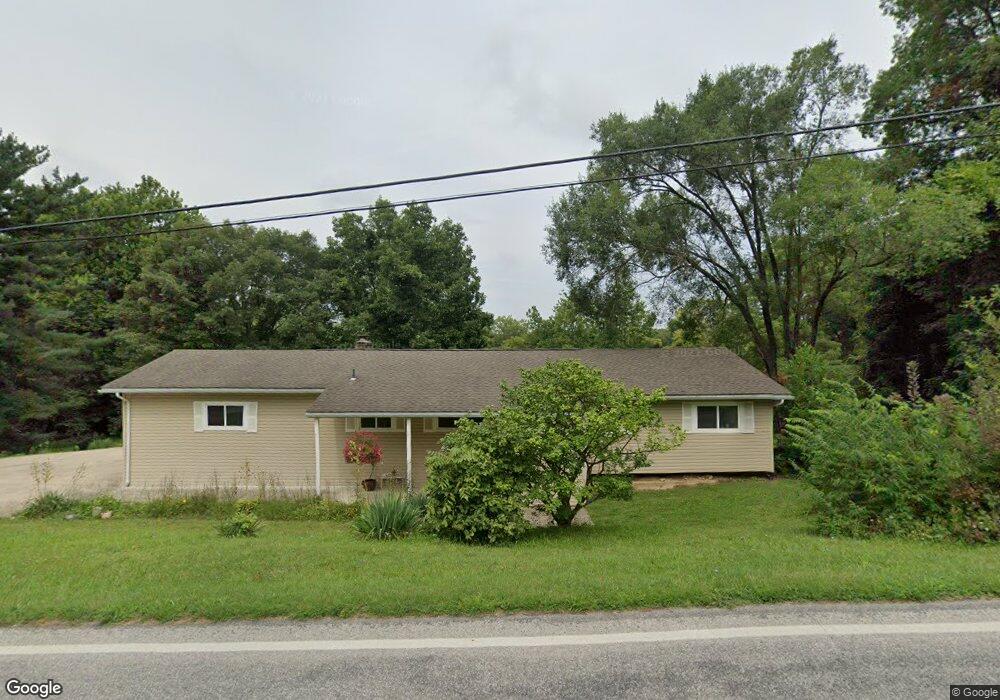
2409 Panhandle Rd Delaware, OH 43015
Troy NeighborhoodEstimated Value: $341,000 - $444,000
4
Beds
2
Baths
2,795
Sq Ft
$138/Sq Ft
Est. Value
About This Home
This home is located at 2409 Panhandle Rd, Delaware, OH 43015 and is currently estimated at $385,775, approximately $138 per square foot. 2409 Panhandle Rd is a home located in Delaware County with nearby schools including David Smith Elementary School, John C. Dempsey Middle School, and Rutherford B. Hayes High School.
Ownership History
Date
Name
Owned For
Owner Type
Purchase Details
Closed on
May 16, 2008
Sold by
Viola David O and Viola Tammy J
Bought by
Askew Nicole
Current Estimated Value
Home Financials for this Owner
Home Financials are based on the most recent Mortgage that was taken out on this home.
Original Mortgage
$184,603
Interest Rate
5.87%
Mortgage Type
FHA
Purchase Details
Closed on
Aug 9, 2006
Sold by
Ringle Christopher A
Bought by
Viola David O and Viola Tammy J
Purchase Details
Closed on
Jul 23, 2003
Sold by
Ringle Kathy Ann and Ringle Christopher A
Bought by
Ringle Christopher A and Ringle Kathy
Home Financials for this Owner
Home Financials are based on the most recent Mortgage that was taken out on this home.
Original Mortgage
$65,000
Interest Rate
6.2%
Mortgage Type
Purchase Money Mortgage
Create a Home Valuation Report for This Property
The Home Valuation Report is an in-depth analysis detailing your home's value as well as a comparison with similar homes in the area
Home Values in the Area
Average Home Value in this Area
Purchase History
| Date | Buyer | Sale Price | Title Company |
|---|---|---|---|
| Askew Nicole | $187,500 | Attorney | |
| Viola David O | $114,140 | Commonwealth Land Title Ins | |
| Ringle Christopher A | -- | Morrow County Title | |
| Ringle Kathy Ann | -- | -- |
Source: Public Records
Mortgage History
| Date | Status | Borrower | Loan Amount |
|---|---|---|---|
| Previous Owner | Askew Nicole | $184,603 | |
| Previous Owner | Ringle Christopher A | $65,000 |
Source: Public Records
Tax History
| Year | Tax Paid | Tax Assessment Tax Assessment Total Assessment is a certain percentage of the fair market value that is determined by local assessors to be the total taxable value of land and additions on the property. | Land | Improvement |
|---|---|---|---|---|
| 2024 | $5,271 | $100,070 | $23,800 | $76,270 |
| 2023 | $5,029 | $100,070 | $23,800 | $76,270 |
| 2022 | $4,364 | $74,350 | $16,840 | $57,510 |
| 2021 | $4,457 | $74,350 | $16,840 | $57,510 |
| 2020 | $4,506 | $74,350 | $16,840 | $57,510 |
| 2019 | $4,644 | $69,410 | $14,630 | $54,780 |
| 2018 | $4,704 | $69,410 | $14,630 | $54,780 |
| 2017 | $4,274 | $61,640 | $10,540 | $51,100 |
| 2016 | $3,862 | $61,640 | $10,540 | $51,100 |
| 2015 | $3,884 | $61,640 | $10,540 | $51,100 |
| 2014 | $3,941 | $61,640 | $10,540 | $51,100 |
| 2013 | $3,748 | $59,190 | $10,540 | $48,650 |
Source: Public Records
Map
Nearby Homes
- 2639 Panhandle Rd
- 2121 Panhandle Rd Unit 69
- 2000 US Highway 23 N Unit 53
- 2000 U S Highway 23 N Unit LOT 59
- 5722 U S Highway 23 N
- 5730 U S Highway 23 N
- 5738 U S Highway 23 N
- 5305 U S Highway 23 N
- 178 Pinecrest Dr
- 208 Shelbourne Forest Way
- 0 Horseshoe Rd Unit Tract 2 225024445
- 2112 Horseshoe Rd
- 1980 U S 23 Unit 61
- 1980 U S 23 Unit 20
- 1980 U S 23 Unit 14
- 1980 U S 23 Unit 38
- 0 Panhandle Rd Unit 225040827
- 0 Panhandle Rd Unit 26283134
- 920 Executive Blvd
- 278 Sylvan Dr
- 2387 Panhandle Rd
- 2572 Panhandle Rd
- 3399 Panhandle Rd
- 1845 Panhandle Rd
- 2422 Panhandle Rd
- 2425 Panhandle Rd
- 2451 Panhandle Rd
- 2360 Panhandle Rd
- 2333 Panhandle Rd
- 2489 Panhandle Rd
- 2303 Panhandle Rd
- 2500 Panhandle Rd
- 2505 Panhandle Rd
- 2279 Panhandle Rd
- 2514 Panhandle Rd
- 2529 Panhandle Rd
- 2259 Panhandle Rd
- 2239 Panhandle Rd
- 2544 Panhandle Rd
- 2566 Panhandle Rd
Your Personal Tour Guide
Ask me questions while you tour the home.