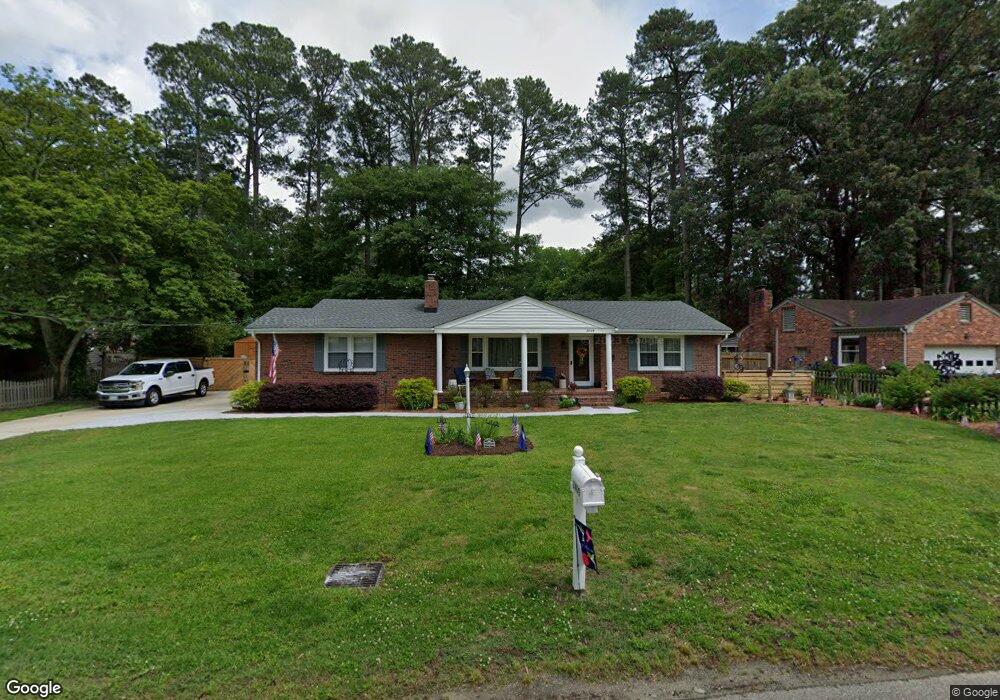
2409 Sterling Point Dr Portsmouth, VA 23703
Churchland NeighborhoodEstimated Value: $346,000 - $388,000
3
Beds
2
Baths
1,757
Sq Ft
$213/Sq Ft
Est. Value
About This Home
This home is located at 2409 Sterling Point Dr, Portsmouth, VA 23703 and is currently estimated at $374,342, approximately $213 per square foot. 2409 Sterling Point Dr is a home located in Portsmouth City with nearby schools including Churchland Elementary School, Churchland Academy Elementary School, and Churchland Middle School.
Ownership History
Date
Name
Owned For
Owner Type
Purchase Details
Closed on
Dec 12, 2024
Sold by
Roberts Thad R and Roberts Robin M
Bought by
Roberts Family Trust and Roberts
Current Estimated Value
Purchase Details
Closed on
Feb 15, 2022
Sold by
Eaton Randy D
Bought by
Roberts Thad R and Roberts Robin M
Purchase Details
Closed on
Aug 11, 2017
Sold by
Klise Betty Cummings
Bought by
Griffin Neal
Purchase Details
Closed on
Oct 12, 2004
Sold by
Atwood Brian D
Bought by
Seay Samuel
Purchase Details
Closed on
Dec 1, 1998
Sold by
Centeno James P
Bought by
Carr Stephanie G
Home Financials for this Owner
Home Financials are based on the most recent Mortgage that was taken out on this home.
Original Mortgage
$121,850
Interest Rate
6.68%
Create a Home Valuation Report for This Property
The Home Valuation Report is an in-depth analysis detailing your home's value as well as a comparison with similar homes in the area
Home Values in the Area
Average Home Value in this Area
Purchase History
| Date | Buyer | Sale Price | Title Company |
|---|---|---|---|
| Roberts Family Trust | -- | None Listed On Document | |
| Roberts Thad R | -- | True North Title | |
| Griffin Neal | $110,000 | Attorney | |
| Seay Samuel | $210,000 | -- | |
| Carr Stephanie G | $123,000 | -- |
Source: Public Records
Mortgage History
| Date | Status | Borrower | Loan Amount |
|---|---|---|---|
| Previous Owner | Carr Stephanie G | $121,850 |
Source: Public Records
Tax History Compared to Growth
Tax History
| Year | Tax Paid | Tax Assessment Tax Assessment Total Assessment is a certain percentage of the fair market value that is determined by local assessors to be the total taxable value of land and additions on the property. | Land | Improvement |
|---|---|---|---|---|
| 2025 | $4,294 | $344,440 | $90,060 | $254,380 |
| 2024 | $4,294 | $335,200 | $90,060 | $245,140 |
| 2023 | $3,740 | $299,190 | $90,060 | $209,130 |
| 2022 | $3,554 | $273,410 | $75,050 | $198,360 |
| 2021 | $3,264 | $251,070 | $65,260 | $185,810 |
| 2020 | $3,177 | $244,380 | $62,160 | $182,220 |
| 2019 | $3,154 | $242,580 | $62,160 | $180,420 |
| 2018 | $2,862 | $220,160 | $62,160 | $158,000 |
| 2017 | $2,862 | $220,160 | $62,160 | $158,000 |
| 2016 | $2,862 | $220,160 | $62,160 | $158,000 |
| 2015 | $2,862 | $220,160 | $62,160 | $158,000 |
| 2014 | $2,796 | $220,160 | $62,160 | $158,000 |
Source: Public Records
Map
Nearby Homes
- 4011 Reese Dr S
- 3000 Ferguson Dr
- 3130 Sterling Point Dr
- 3128 Sterling Point Dr
- 5111 Sweetbriar Cir
- 2805 Acres Rd
- 4412 Gannon Rd
- 4305 Manchester Rd
- 5006 High St W
- 3917 Oak Dr E
- 4417 Gannon Rd
- 3205 Clover Hill Dr
- 5221 High St W
- 3233 Clover Hill Dr
- 4707 High St W
- 3909 Point Elizabeth Dr
- 5302 High St W
- 3101 Laurel Ln
- 3200 Westwood Crescent
- 5304 High St W
- 2413 Sterling Point Dr
- 2405 Sterling Point Dr
- 2408 Bidgood Dr
- 2404 Bidgood Dr
- 2412 Bidgood Dr
- 2401 Sterling Point Dr
- 2417 Sterling Point Dr
- 2408 Sterling Point Dr
- 2404 Sterling Point Dr
- 2416 Bidgood Dr
- 2400 Sterling Point Dr
- 2405 Bidgood Dr
- 2409 Bidgood Dr
- 2421 Sterling Point Dr
- 5205 Bridges Ave
- 2413 Bidgood Dr
- 2416 Sterling Point Dr
- 2420 Bidgood Dr
- 2325 Sterling Point Dr
- 2320 Bidgood Dr