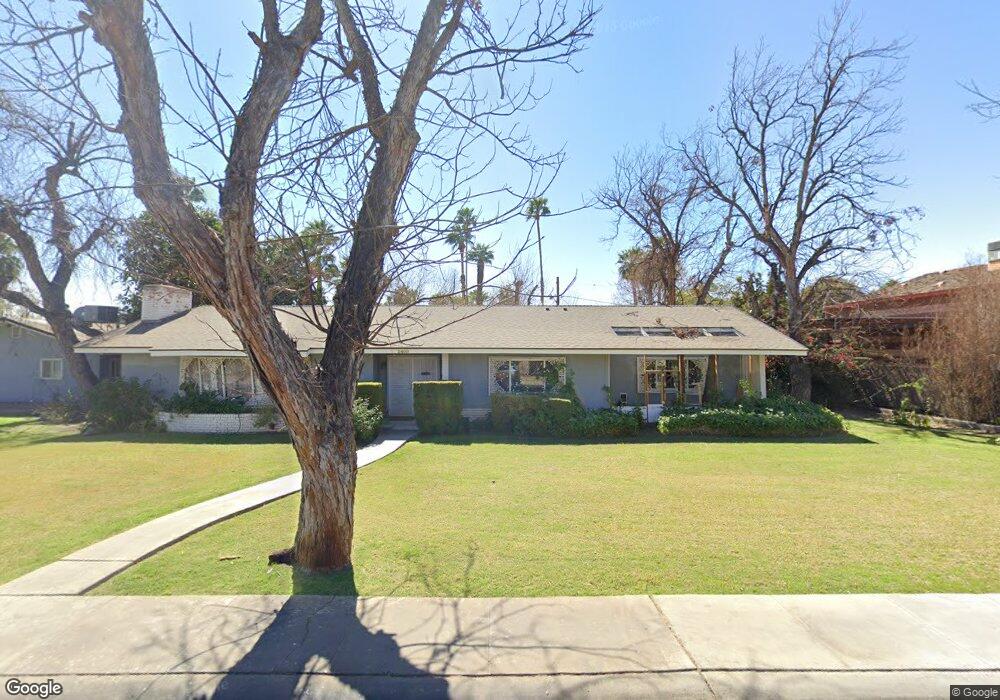
2409 W 4th Place Yuma, AZ 85364
Townsend NeighborhoodEstimated Value: $386,190 - $431,000
2
Beds
2
Baths
3,364
Sq Ft
$122/Sq Ft
Est. Value
About This Home
This home is located at 2409 W 4th Place, Yuma, AZ 85364 and is currently estimated at $410,048, approximately $121 per square foot. 2409 W 4th Place is a home located in Yuma County with nearby schools including Pecan Grove Elementary School, Fourth Avenue Junior High School, and Yuma High School.
Ownership History
Date
Name
Owned For
Owner Type
Purchase Details
Closed on
Nov 26, 2012
Sold by
Sanasac Paul B
Bought by
Sanasac Paul B and Sanasac Maria D
Current Estimated Value
Home Financials for this Owner
Home Financials are based on the most recent Mortgage that was taken out on this home.
Original Mortgage
$211,650
Outstanding Balance
$146,362
Interest Rate
3.33%
Mortgage Type
VA
Estimated Equity
$263,686
Purchase Details
Closed on
Jul 17, 2006
Sold by
Mcdaniel Mildred Washburn
Bought by
Sanasac Paul B
Purchase Details
Closed on
Aug 10, 2000
Sold by
Mcdaniel Malcolm Bruce
Bought by
Mcdaniel Mildred Washburn
Create a Home Valuation Report for This Property
The Home Valuation Report is an in-depth analysis detailing your home's value as well as a comparison with similar homes in the area
Home Values in the Area
Average Home Value in this Area
Purchase History
| Date | Buyer | Sale Price | Title Company |
|---|---|---|---|
| Sanasac Paul B | -- | Chicago Title | |
| Sanasac Paul B | $140,000 | None Available | |
| Mcdaniel Mildred Washburn | -- | -- |
Source: Public Records
Mortgage History
| Date | Status | Borrower | Loan Amount |
|---|---|---|---|
| Open | Sanasac Paul B | $211,650 |
Source: Public Records
Tax History Compared to Growth
Tax History
| Year | Tax Paid | Tax Assessment Tax Assessment Total Assessment is a certain percentage of the fair market value that is determined by local assessors to be the total taxable value of land and additions on the property. | Land | Improvement |
|---|---|---|---|---|
| 2025 | $2,702 | $26,939 | $6,748 | $20,191 |
| 2024 | $2,652 | $25,657 | $6,664 | $18,993 |
| 2023 | $2,652 | $24,435 | $5,394 | $19,041 |
| 2022 | $2,560 | $23,271 | $5,624 | $17,647 |
| 2021 | $2,716 | $22,163 | $5,542 | $16,621 |
| 2020 | $2,482 | $21,107 | $6,748 | $14,359 |
| 2019 | $2,437 | $20,102 | $6,266 | $13,836 |
| 2018 | $2,316 | $19,145 | $5,959 | $13,186 |
| 2017 | $2,217 | $19,145 | $5,959 | $13,186 |
| 2016 | $2,165 | $17,365 | $8,219 | $9,146 |
| 2015 | $1,787 | $16,538 | $9,464 | $7,074 |
| 2014 | $1,787 | $15,751 | $7,000 | $8,751 |
Source: Public Records
Map
Nearby Homes
- 584 S Avenue B
- 650 S Avenue B
- 308 S 19th Ave
- 187 S San Clemente Dr
- 680 S 20th Ave
- 2766 W 2nd Place
- 502 S Magnolia Ave
- 125 S 23rd Ave
- 540 S Magnolia Ave
- 3049 W 5th St
- 671 S 16th Ave
- 263 S 16th Ave
- 572 S 15th Ave
- S Avenue B
- 2779 W 8th St Unit 17A
- 2779 W 8th St Unit 193
- 1031 S Brahma Ln
- 1111 S Avenue B Unit 36
- 1111 S Avenue B Unit A
- 304 S May Ave Unit 92
- 2400 W 5th St
- 2437 W 4th Place
- 2437 W 4th Place
- 2400 W 4th Place
- 2424 W 5th St
- 411 S 24th Ave
- 2440 W 4th Place
- 415 S 24th Ave
- 407 S 24th Ave
- 2455 W 4th Place
- 2450 W 4th Place
- 2444 W 5th St
- 405 S 24th Ave
- 2401 W 4th St
- 2411 W 5th St
- 2421 W 5th St
- 412 S 23rd Ave
- 2435 W 4th St
- 408 S 23rd Ave
- 414 S 23rd Ave