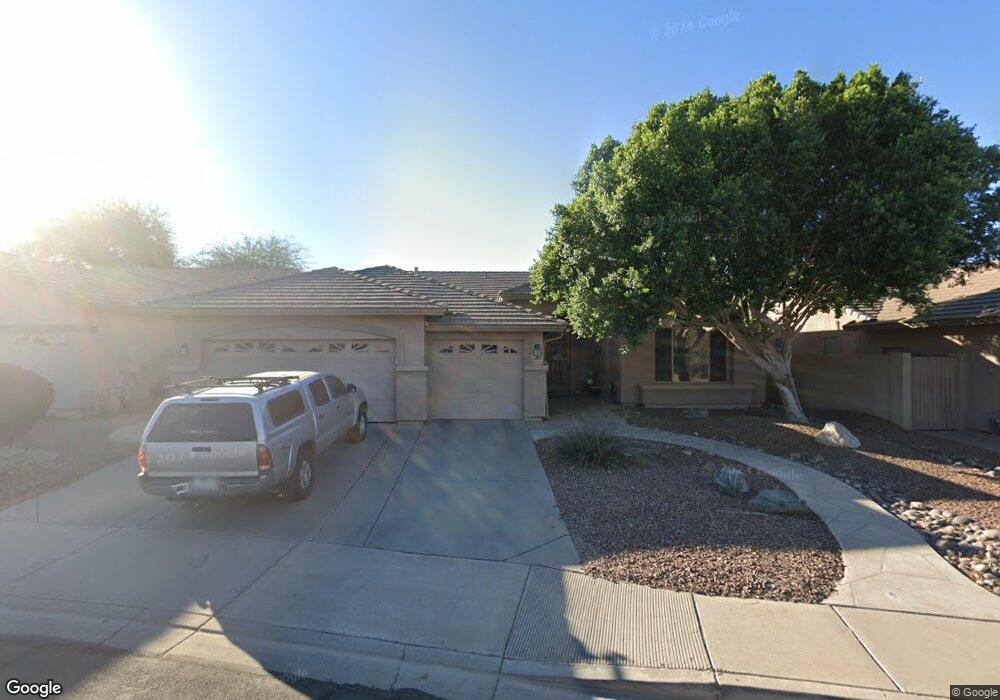
2409 W Megan St Chandler, AZ 85224
Central Ridge NeighborhoodEstimated Value: $670,010 - $914,000
3
Beds
3
Baths
2,611
Sq Ft
$304/Sq Ft
Est. Value
About This Home
This home is located at 2409 W Megan St, Chandler, AZ 85224 and is currently estimated at $792,753, approximately $303 per square foot. 2409 W Megan St is a home located in Maricopa County with nearby schools including Andersen Elementary School, Andersen Junior High School, and Chandler High School.
Ownership History
Date
Name
Owned For
Owner Type
Purchase Details
Closed on
May 7, 2010
Sold by
Rbu Investments Llc
Bought by
Chang Eric C and Chang Kathy F
Current Estimated Value
Home Financials for this Owner
Home Financials are based on the most recent Mortgage that was taken out on this home.
Original Mortgage
$234,400
Outstanding Balance
$157,032
Interest Rate
5.04%
Mortgage Type
New Conventional
Estimated Equity
$635,721
Purchase Details
Closed on
Feb 9, 1998
Sold by
Del Webbs Coventry Homes Inc
Bought by
Sivonen Peter and Sivonen Cynthia H
Home Financials for this Owner
Home Financials are based on the most recent Mortgage that was taken out on this home.
Original Mortgage
$150,950
Interest Rate
6.9%
Mortgage Type
New Conventional
Purchase Details
Closed on
Feb 6, 1998
Sold by
Del Webbs Coventry Homes Construction Co
Bought by
Del Webbs Coventry Homes Inc
Home Financials for this Owner
Home Financials are based on the most recent Mortgage that was taken out on this home.
Original Mortgage
$150,950
Interest Rate
6.9%
Mortgage Type
New Conventional
Create a Home Valuation Report for This Property
The Home Valuation Report is an in-depth analysis detailing your home's value as well as a comparison with similar homes in the area
Home Values in the Area
Average Home Value in this Area
Purchase History
| Date | Buyer | Sale Price | Title Company |
|---|---|---|---|
| Chang Eric C | $310,000 | American Title Service Agenc | |
| Sivonen Peter | $205,995 | First American Title | |
| Del Webbs Coventry Homes Inc | -- | First American Title |
Source: Public Records
Mortgage History
| Date | Status | Borrower | Loan Amount |
|---|---|---|---|
| Open | Chang Eric C | $234,400 | |
| Previous Owner | Sivonen Peter | $150,950 |
Source: Public Records
Tax History Compared to Growth
Tax History
| Year | Tax Paid | Tax Assessment Tax Assessment Total Assessment is a certain percentage of the fair market value that is determined by local assessors to be the total taxable value of land and additions on the property. | Land | Improvement |
|---|---|---|---|---|
| 2025 | $3,059 | $34,166 | -- | -- |
| 2024 | $3,083 | $32,539 | -- | -- |
| 2023 | $3,083 | $54,330 | $10,860 | $43,470 |
| 2022 | $2,986 | $41,320 | $8,260 | $33,060 |
| 2021 | $3,069 | $38,470 | $7,690 | $30,780 |
| 2020 | $3,052 | $36,620 | $7,320 | $29,300 |
| 2019 | $2,489 | $35,500 | $7,100 | $28,400 |
| 2018 | $2,410 | $35,380 | $7,070 | $28,310 |
| 2017 | $2,246 | $33,930 | $6,780 | $27,150 |
| 2016 | $2,164 | $33,860 | $6,770 | $27,090 |
| 2015 | $2,097 | $26,850 | $5,370 | $21,480 |
Source: Public Records
Map
Nearby Homes
- 2466 W Shannon St
- 2455 W Shannon St
- 2580 W Shannon Ct
- 2541 W Park Ave
- 2571 W Park Ave
- 2323 W Harrison St
- 810 N Los Altos Dr
- 601 N Bullmoose Dr
- 2784 W Del Rio Place
- 700 N Dobson Rd Unit 11
- 1367 N Los Altos Dr
- 855 N Dobson Rd Unit 2090
- 2609 W Upland Dr
- 1825 W Ray Rd Unit 1008
- 1825 W Ray Rd Unit 1063
- 1825 W Ray Rd Unit 1054
- 1825 W Ray Rd Unit 2070
- 1825 W Ray Rd Unit 2044
- 1825 W Ray Rd Unit 1083
- 1825 W Ray Rd Unit 2082
- 2419 W Megan St
- 2399 W Megan St
- 2429 W Megan St
- 2389 W Megan St
- 2400 W Megan St
- 2410 W Megan St
- 2379 W Megan St
- 2390 W Megan St
- 2439 W Megan St
- 2430 W Megan St
- 2380 W Megan St
- 910 N Bullmoose Dr
- 2436 W Shannon St
- 2369 W Megan St
- 2446 W Shannon St
- 2426 W Shannon St
- 2440 W Megan St
- 900 N Bullmoose Dr
- 2416 W Shannon St
- 2486 W Shannon St