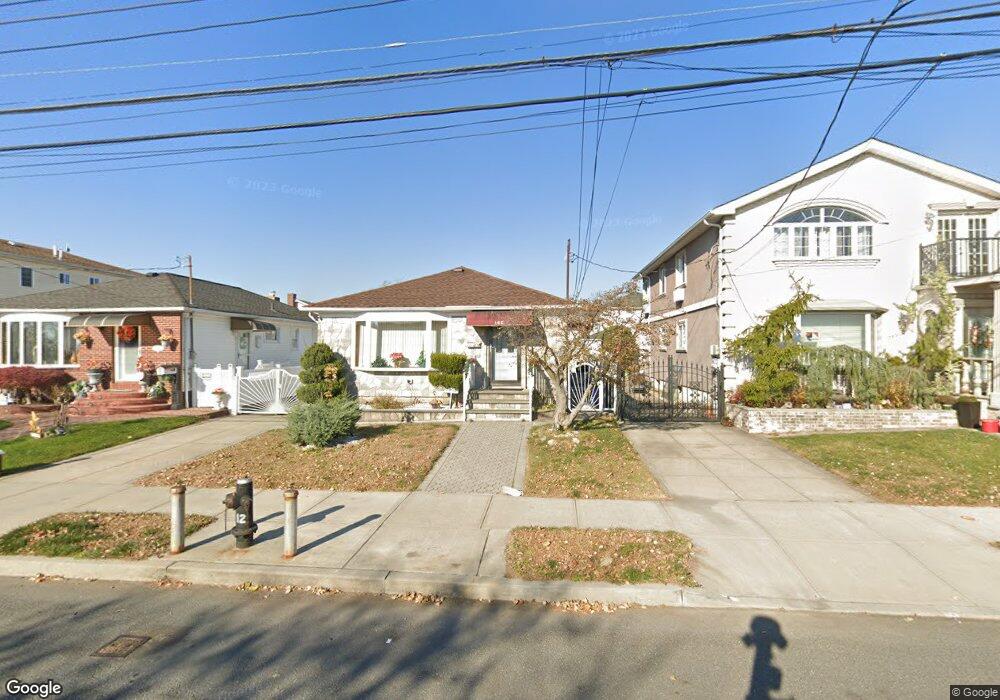
241-19 149th Ave Rosedale, NY 11422
Rosedale NeighborhoodEstimated Value: $631,000 - $794,751
3
Beds
3
Baths
1,025
Sq Ft
$678/Sq Ft
Est. Value
About This Home
This home is located at 241-19 149th Ave, Rosedale, NY 11422 and is currently estimated at $694,438, approximately $677 per square foot. 241-19 149th Ave is a home located in Queens County with nearby schools including P.S. 181 Brookfield, Collaborative Arts Middle School, and Success Academy Charter School - Rosedale.
Ownership History
Date
Name
Owned For
Owner Type
Purchase Details
Closed on
Dec 5, 2023
Sold by
Davy Stoudamire and Stephenson Lorna
Bought by
Clennon Ahsaki
Current Estimated Value
Home Financials for this Owner
Home Financials are based on the most recent Mortgage that was taken out on this home.
Original Mortgage
$618,860
Outstanding Balance
$608,588
Interest Rate
7.5%
Mortgage Type
Purchase Money Mortgage
Estimated Equity
$85,850
Purchase Details
Closed on
May 5, 2020
Sold by
Tsadik Equities Llc
Bought by
Stephenson Lorna and Stoudamire Davy
Home Financials for this Owner
Home Financials are based on the most recent Mortgage that was taken out on this home.
Original Mortgage
$551,000
Interest Rate
3.3%
Mortgage Type
New Conventional
Purchase Details
Closed on
Aug 22, 2019
Sold by
Lee Sirganer
Bought by
Tsadik Equities Llc
Create a Home Valuation Report for This Property
The Home Valuation Report is an in-depth analysis detailing your home's value as well as a comparison with similar homes in the area
Home Values in the Area
Average Home Value in this Area
Purchase History
| Date | Buyer | Sale Price | Title Company |
|---|---|---|---|
| Clennon Ahsaki | $638,000 | -- | |
| Clennon Ahsaki | $638,000 | -- | |
| Stephenson Lorna | $580,000 | -- | |
| Stephenson Lorna | $580,000 | -- | |
| Tsadik Equities Llc | $275,000 | -- | |
| Tsadik Equities Llc | $275,000 | -- |
Source: Public Records
Mortgage History
| Date | Status | Borrower | Loan Amount |
|---|---|---|---|
| Open | Clennon Ahsaki | $618,860 | |
| Closed | Clennon Ahsaki | $618,860 | |
| Previous Owner | Stephenson Lorna | $551,000 |
Source: Public Records
Tax History Compared to Growth
Tax History
| Year | Tax Paid | Tax Assessment Tax Assessment Total Assessment is a certain percentage of the fair market value that is determined by local assessors to be the total taxable value of land and additions on the property. | Land | Improvement |
|---|---|---|---|---|
| 2025 | $5,345 | $26,611 | $6,201 | $20,410 |
| 2024 | $5,345 | $26,611 | $6,460 | $20,151 |
| 2023 | $5,304 | $26,410 | $6,954 | $19,456 |
| 2022 | $4,974 | $34,080 | $10,080 | $24,000 |
| 2021 | $4,947 | $33,540 | $10,080 | $23,460 |
| 2020 | $4,694 | $29,700 | $10,080 | $19,620 |
| 2019 | $4,639 | $25,440 | $10,080 | $15,360 |
| 2018 | $4,486 | $22,008 | $10,074 | $11,934 |
| 2017 | $4,233 | $20,763 | $8,808 | $11,955 |
| 2016 | $3,916 | $20,763 | $8,808 | $11,955 |
| 2015 | $3,020 | $18,480 | $8,640 | $9,840 |
| 2014 | $3,020 | $18,480 | $8,640 | $9,840 |
Source: Public Records
Map
Nearby Homes
- 240-24 149th Ave
- 241-49 148th Dr
- 238-47 148th Dr
- 24112 148th Ave
- 241-12 148th Ave
- 241-23 148th Ave
- 238-11 148th Dr
- 147-87 Brookville Blvd Unit 2 family
- 241-27 147th Dr
- 23915 147th Rd
- 26 240th St
- 245-47 148th Dr
- 24519 147th Dr
- 23514 147th Dr
- 245-39 147th Dr
- 24533 147th Rd
- 24930 147th Rd
- 25301 148th Ave
- 146-15 243rd St
- 14632 Huxley St
- 24119 149th Ave
- 24115 149th Ave
- 24123 149th Ave
- 241 W 15th St
- 241 W 15th St Unit 3-RE
- 241 W 15th St Unit BW
- 241 W 15th St Unit 5FE
- 241 W 15th St Unit W-3
- 241 W 15th St Unit 3RW
- 241 W 15th St Unit 1FW
- 241 W 15th St Unit 2FE
- 241 W 15th St Unit 4FE
- 241 W 15th St Unit 1RW
- 241 W 15th St Unit 3FE
- 241 W 15th St Unit 5RW
- 241 W 15th St Unit 3FW
- 241 W 15th St Unit 5RE
- 241 W 15th St Unit 5FW
- 241 W 15th St Unit 4-RE
- 241 W 15th St Unit 2-FW