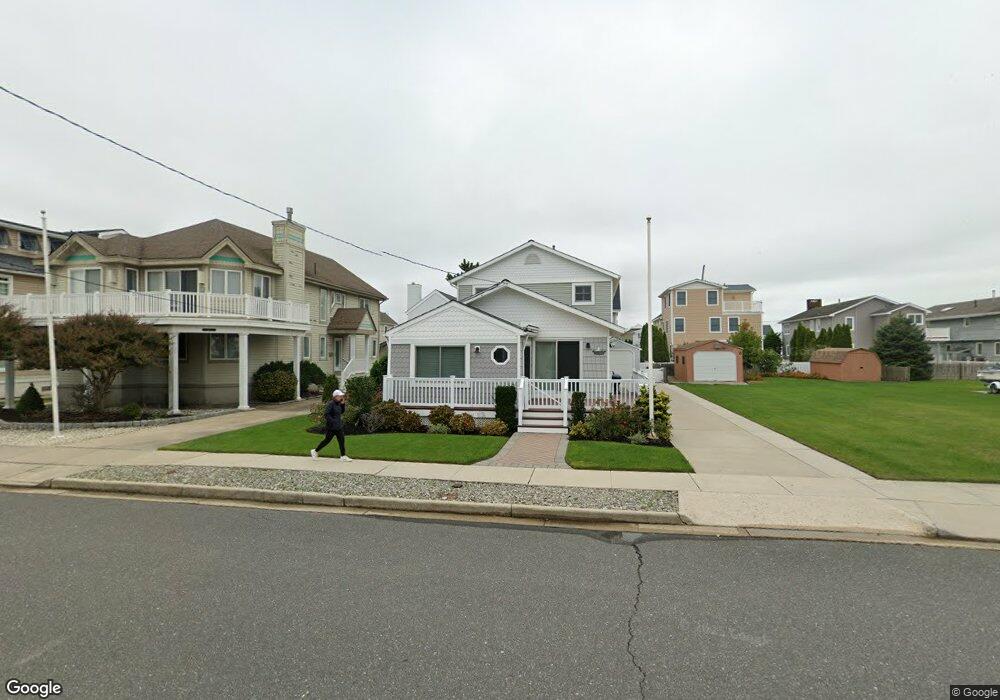
241 42nd St Avalon, NJ 08202
Estimated Value: $1,520,000 - $2,549,904
--
Bed
--
Bath
2,017
Sq Ft
$1,117/Sq Ft
Est. Value
About This Home
This home is located at 241 42nd St, Avalon, NJ 08202 and is currently estimated at $2,253,476, approximately $1,117 per square foot. 241 42nd St is a home located in Cape May County with nearby schools including Avalon Elementary School.
Ownership History
Date
Name
Owned For
Owner Type
Purchase Details
Closed on
Feb 20, 2024
Sold by
Henry Barry E and Moffett Deborah
Bought by
241 42Nd Street Llc
Current Estimated Value
Purchase Details
Closed on
May 17, 2023
Sold by
Ciavarelli Randi
Bought by
Henry Barry E and Moffett Deborah
Purchase Details
Closed on
Mar 6, 2023
Sold by
Henry Barry E
Bought by
Henry Barry E and Manderack Sharon
Purchase Details
Closed on
Aug 26, 2019
Sold by
Henry Rebecca R Est
Bought by
Henry Barry E
Purchase Details
Closed on
Jun 10, 2013
Sold by
Henry Barry E and Henry Rebecca R
Bought by
Henry Barry E and Henry Rebecca R
Purchase Details
Closed on
Feb 13, 1996
Sold by
Erickson Carol Wick
Bought by
Henry Barry and Henry Rebecca
Home Financials for this Owner
Home Financials are based on the most recent Mortgage that was taken out on this home.
Original Mortgage
$194,000
Interest Rate
7.04%
Create a Home Valuation Report for This Property
The Home Valuation Report is an in-depth analysis detailing your home's value as well as a comparison with similar homes in the area
Home Values in the Area
Average Home Value in this Area
Purchase History
| Date | Buyer | Sale Price | Title Company |
|---|---|---|---|
| 241 42Nd Street Llc | -- | None Listed On Document | |
| 241 42Nd Street Llc | -- | None Listed On Document | |
| Henry Barry E | $649,375 | Shore Title | |
| Henry Barry E | $649,375 | Shore Title | |
| Henry Barry E | -- | None Listed On Document | |
| Henry Barry E | -- | None Listed On Document | |
| Henry Barry E | -- | -- | |
| Henry Barry E | -- | None Available | |
| Henry Barry | $215,000 | -- |
Source: Public Records
Mortgage History
| Date | Status | Borrower | Loan Amount |
|---|---|---|---|
| Previous Owner | Henry Barry | $194,000 |
Source: Public Records
Tax History Compared to Growth
Tax History
| Year | Tax Paid | Tax Assessment Tax Assessment Total Assessment is a certain percentage of the fair market value that is determined by local assessors to be the total taxable value of land and additions on the property. | Land | Improvement |
|---|---|---|---|---|
| 2025 | $6,443 | $1,049,400 | $950,000 | $99,400 |
| 2024 | $6,443 | $1,049,400 | $950,000 | $99,400 |
| 2023 | $6,391 | $1,049,400 | $950,000 | $99,400 |
| 2022 | $5,961 | $1,049,400 | $950,000 | $99,400 |
| 2021 | $5,740 | $1,049,400 | $950,000 | $99,400 |
| 2020 | $5,520 | $1,049,400 | $950,000 | $99,400 |
| 2019 | $5,352 | $1,049,400 | $950,000 | $99,400 |
| 2018 | $5,121 | $1,049,400 | $950,000 | $99,400 |
| 2017 | $4,352 | $782,700 | $687,500 | $95,200 |
| 2016 | $4,305 | $782,700 | $687,500 | $95,200 |
| 2015 | $4,234 | $782,700 | $687,500 | $95,200 |
| 2014 | $4,187 | $782,700 | $687,500 | $95,200 |
Source: Public Records
Map
Nearby Homes