Estimated Value: $223,823 - $239,000
4
Beds
2
Baths
1,053
Sq Ft
$220/Sq Ft
Est. Value
About This Home
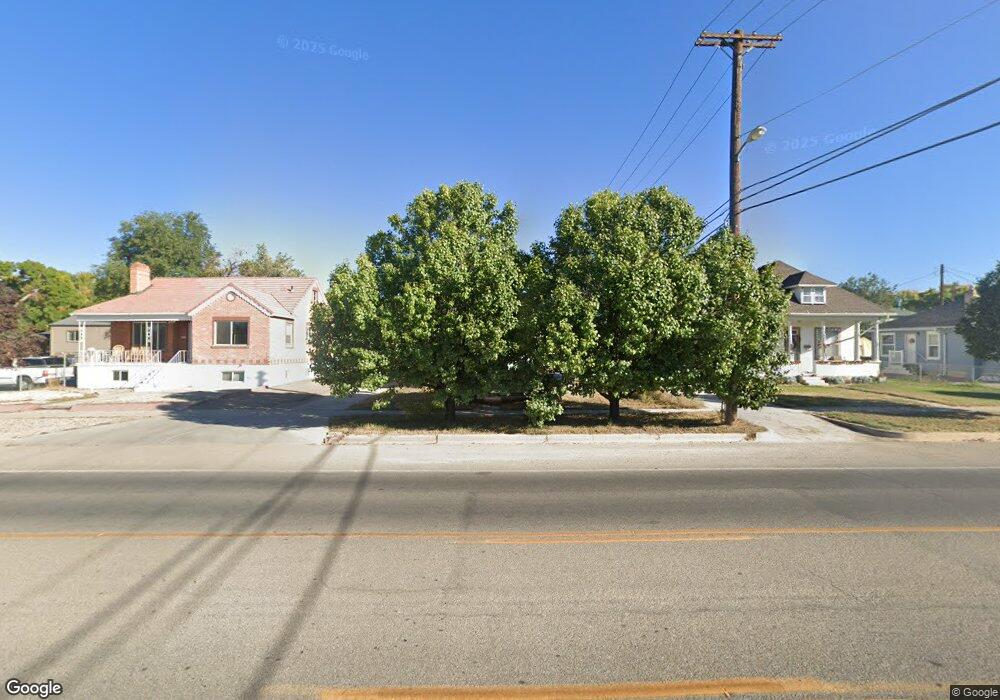
This home is located at 241 E 100 N, Price, UT 84501 and is currently estimated at $231,206, approximately $219 per square foot. 241 E 100 N is a home located in Carbon County with nearby schools including Castle Heights School, Mont Harmon Junior High School, and Carbon High School.
Ownership History
Date
Name
Owned For
Owner Type
Purchase Details
Closed on
Nov 9, 2015
Sold by
Anast Anthony C
Bought by
Benson Warren and Benson Hailee
Current Estimated Value
Home Financials for this Owner
Home Financials are based on the most recent Mortgage that was taken out on this home.
Original Mortgage
$61,600
Outstanding Balance
$48,351
Interest Rate
3.81%
Mortgage Type
New Conventional
Estimated Equity
$182,855
Purchase Details
Closed on
Sep 26, 2005
Sold by
Senor Nikki E
Bought by
Anast Anthony C
Create a Home Valuation Report for This Property
The Home Valuation Report is an in-depth analysis detailing your home's value as well as a comparison with similar homes in the area
Purchase History
| Date | Buyer | Sale Price | Title Company |
|---|---|---|---|
| Benson Warren | -- | Professional Title Services | |
| Anast Anthony C | -- | Professional Title Services | |
| Anast Anthony C | -- | Professional Title Services |
Source: Public Records
Mortgage History
| Date | Status | Borrower | Loan Amount |
|---|---|---|---|
| Open | Benson Warren | $61,600 |
Source: Public Records
Tax History
| Year | Tax Paid | Tax Assessment Tax Assessment Total Assessment is a certain percentage of the fair market value that is determined by local assessors to be the total taxable value of land and additions on the property. | Land | Improvement |
|---|---|---|---|---|
| 2025 | $1,080 | $88,916 | $16,361 | $72,555 |
| 2024 | $1,495 | $124,469 | $14,438 | $110,031 |
| 2023 | $1,006 | $89,306 | $10,707 | $78,599 |
| 2022 | $1,047 | $83,400 | $8,902 | $74,498 |
| 2021 | $904 | $111,755 | $13,602 | $98,153 |
| 2020 | $888 | $55,099 | $0 | $0 |
| 2019 | $792 | $51,535 | $0 | $0 |
| 2018 | $638 | $42,350 | $0 | $0 |
| 2017 | $630 | $42,350 | $0 | $0 |
| 2016 | $766 | $42,350 | $0 | $0 |
| 2015 | $766 | $57,099 | $0 | $0 |
| 2014 | $761 | $57,099 | $0 | $0 |
| 2013 | $744 | $55,230 | $0 | $0 |
Source: Public Records
Map
Nearby Homes
Your Personal Tour Guide
Ask me questions while you tour the home.