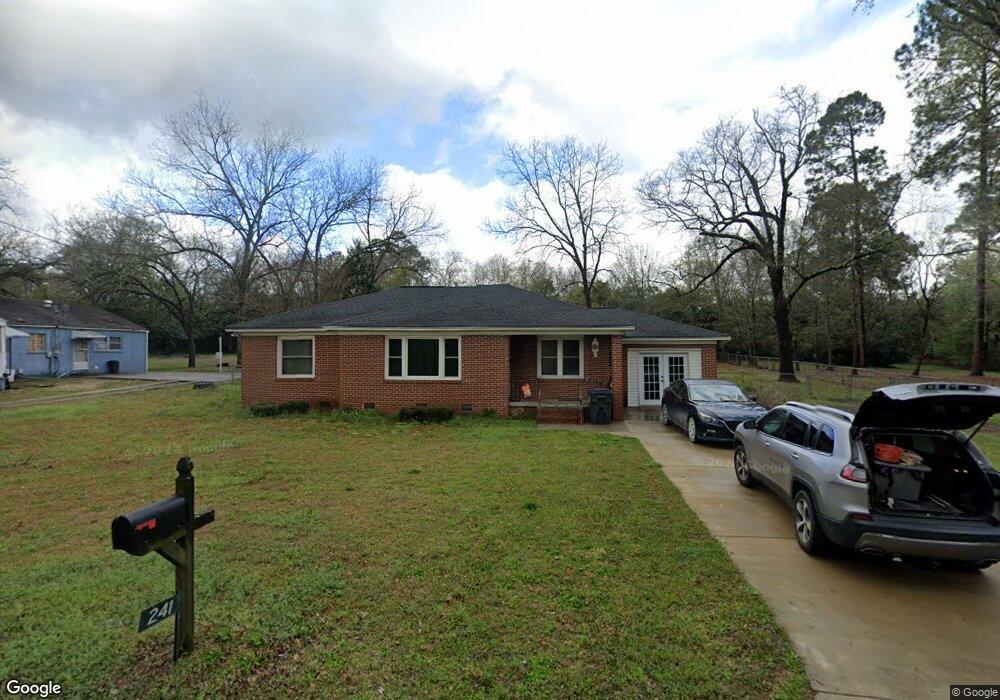
241 E Beech St Cochran, GA 31014
Estimated Value: $109,000 - $164,586
3
Beds
2
Baths
1,665
Sq Ft
$83/Sq Ft
Est. Value
About This Home
This home is located at 241 E Beech St, Cochran, GA 31014 and is currently estimated at $137,647, approximately $82 per square foot. 241 E Beech St is a home located in Bleckley County with nearby schools including Bleckley County Primary School, Bleckley County Elementary School, and Bleckley Middle School.
Ownership History
Date
Name
Owned For
Owner Type
Purchase Details
Closed on
Sep 1, 2020
Sold by
Reagan Jeffery
Bought by
Mcknight Christine
Current Estimated Value
Home Financials for this Owner
Home Financials are based on the most recent Mortgage that was taken out on this home.
Original Mortgage
$71,250
Outstanding Balance
$61,887
Interest Rate
2.8%
Mortgage Type
New Conventional
Estimated Equity
$75,760
Purchase Details
Closed on
Mar 30, 2016
Sold by
Bank Of Eastman
Bought by
Reagan Jeffery and Reagan Tina R
Purchase Details
Closed on
Sep 1, 2015
Sold by
Dale Ollie Rouse
Bought by
Bank Of Eastman
Purchase Details
Closed on
Mar 26, 1997
Sold by
Federal National Mor
Bought by
Dale Ollie Rouse
Purchase Details
Closed on
Jan 7, 1997
Sold by
Ge Capital Mortgage
Bought by
Federal National Mor
Purchase Details
Closed on
Oct 6, 1994
Bought by
Spears Donna Wingat
Create a Home Valuation Report for This Property
The Home Valuation Report is an in-depth analysis detailing your home's value as well as a comparison with similar homes in the area
Home Values in the Area
Average Home Value in this Area
Purchase History
| Date | Buyer | Sale Price | Title Company |
|---|---|---|---|
| Mcknight Christine | $75,000 | -- | |
| Reagan Jeffery | $25,000 | -- | |
| Bank Of Eastman | -- | -- | |
| Dale Ollie Rouse | $40,400 | -- | |
| Federal National Mor | $40,000 | -- | |
| Ge Capital Mortgage | $40,000 | -- | |
| Spears Donna Wingat | $54,000 | -- |
Source: Public Records
Mortgage History
| Date | Status | Borrower | Loan Amount |
|---|---|---|---|
| Open | Mcknight Christine | $71,250 |
Source: Public Records
Tax History
| Year | Tax Paid | Tax Assessment Tax Assessment Total Assessment is a certain percentage of the fair market value that is determined by local assessors to be the total taxable value of land and additions on the property. | Land | Improvement |
|---|---|---|---|---|
| 2025 | $1,986 | $53,160 | $3,000 | $50,160 |
| 2024 | $2,003 | $53,160 | $3,000 | $50,160 |
| 2023 | $2,172 | $53,160 | $3,000 | $50,160 |
| 2022 | $1,279 | $47,000 | $3,000 | $44,000 |
| 2021 | $852 | $35,720 | $3,000 | $32,720 |
| 2020 | $1,019 | $35,720 | $3,000 | $32,720 |
| 2019 | $770 | $27,002 | $3,000 | $24,002 |
| 2018 | $1,092 | $27,002 | $3,000 | $24,002 |
| 2017 | $289 | $27,002 | $3,000 | $24,002 |
| 2016 | $787 | $27,002 | $3,000 | $24,002 |
| 2015 | -- | $27,002 | $3,000 | $24,002 |
| 2014 | -- | $27,002 | $3,000 | $24,002 |
| 2013 | -- | $27,002 | $3,000 | $24,002 |
Source: Public Records
Map
Nearby Homes
- 0 Beech St Unit 8246861
- 0 Beech St Unit 7635915
- 0 Beech St Unit 82798
- 0 Beech St Unit 97484
- 0 Beech St Unit 8466971
- 237 E Beech St
- 251 E Beech St
- 233 E Beech St
- 242 Ash St
- 246 Ash St
- 238 Ash St
- 248 Ash St
- 255 E Beech St
- 234 Ash St
- 232 E Beech St
- 229 E Beech St
- 107 11th St
- 232 Ash St
- 228 E Beech St
- 239 Ash St
Your Personal Tour Guide
Ask me questions while you tour the home.