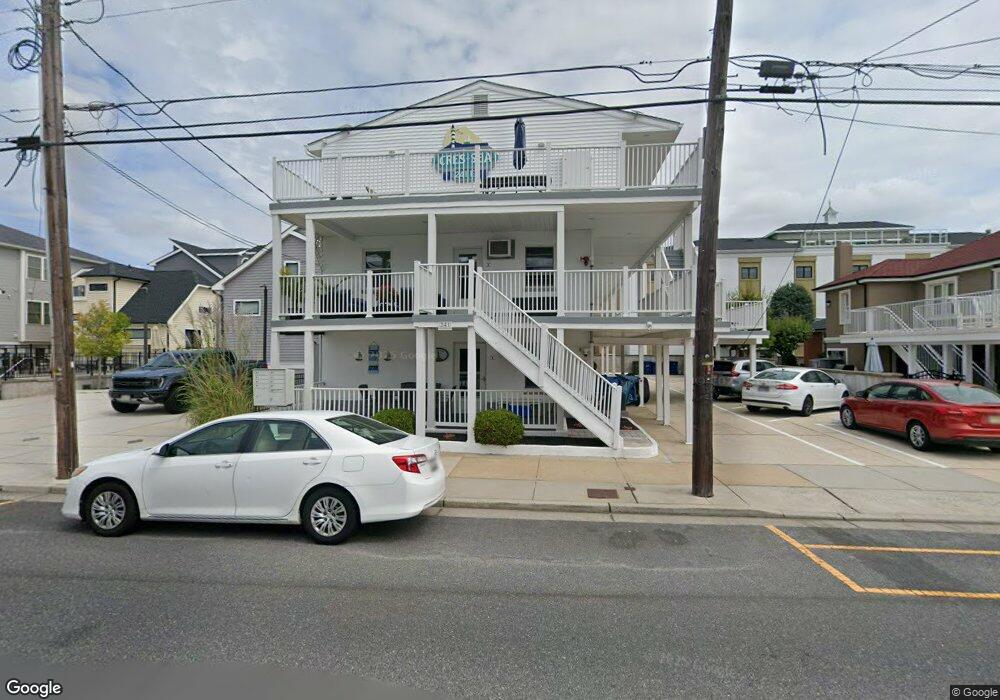
241 E Cresse Ave Unit 2 Wildwood, NJ 08260
The Wildwoods NeighborhoodEstimated Value: $320,000 - $354,802
--
Bed
1
Bath
686
Sq Ft
$495/Sq Ft
Est. Value
About This Home
This home is located at 241 E Cresse Ave Unit 2, Wildwood, NJ 08260 and is currently estimated at $339,451, approximately $494 per square foot. 241 E Cresse Ave Unit 2 is a home located in Cape May County with nearby schools including Glenwood Avenue Elementary School, Wildwood Middle School, and Wildwood High School.
Ownership History
Date
Name
Owned For
Owner Type
Purchase Details
Closed on
Aug 16, 2019
Sold by
Kee Kevin D and Kee Nicole L
Bought by
Kane Robert F and Kane Lisa A
Current Estimated Value
Home Financials for this Owner
Home Financials are based on the most recent Mortgage that was taken out on this home.
Original Mortgage
$139,200
Outstanding Balance
$122,163
Interest Rate
3.8%
Mortgage Type
New Conventional
Estimated Equity
$217,288
Purchase Details
Closed on
Jan 13, 2017
Sold by
Aversa Rocco and Aversa Vivien K
Bought by
Kee Kevin D and Kee Nicole L
Home Financials for this Owner
Home Financials are based on the most recent Mortgage that was taken out on this home.
Original Mortgage
$132,000
Interest Rate
4.16%
Mortgage Type
New Conventional
Purchase Details
Closed on
Mar 15, 2013
Sold by
Yatsk David J and Yatsk Christine M
Bought by
Aversa Rocco and Aversa Vivien K
Create a Home Valuation Report for This Property
The Home Valuation Report is an in-depth analysis detailing your home's value as well as a comparison with similar homes in the area
Home Values in the Area
Average Home Value in this Area
Purchase History
| Date | Buyer | Sale Price | Title Company |
|---|---|---|---|
| Kane Robert F | $174,000 | Shore Title | |
| Kee Kevin D | $165,000 | None Available | |
| Kee Kevin D | $165,000 | Surety Title | |
| Aversa Rocco | $155,000 | None Available |
Source: Public Records
Mortgage History
| Date | Status | Borrower | Loan Amount |
|---|---|---|---|
| Open | Kane Robert F | $139,200 | |
| Previous Owner | Kee Kevin D | $132,000 |
Source: Public Records
Tax History Compared to Growth
Tax History
| Year | Tax Paid | Tax Assessment Tax Assessment Total Assessment is a certain percentage of the fair market value that is determined by local assessors to be the total taxable value of land and additions on the property. | Land | Improvement |
|---|---|---|---|---|
| 2025 | $4,820 | $160,600 | $90,000 | $70,600 |
| 2024 | $4,820 | $160,600 | $90,000 | $70,600 |
| 2023 | $4,704 | $160,600 | $90,000 | $70,600 |
| 2022 | $4,548 | $160,600 | $90,000 | $70,600 |
| 2021 | $3,292 | $160,600 | $90,000 | $70,600 |
| 2020 | $4,320 | $160,600 | $90,000 | $70,600 |
| 2019 | $4,166 | $160,600 | $90,000 | $70,600 |
| 2018 | $4,013 | $160,600 | $90,000 | $70,600 |
| 2017 | $3,845 | $160,600 | $90,000 | $70,600 |
| 2016 | $3,732 | $160,600 | $90,000 | $70,600 |
| 2015 | $3,673 | $160,600 | $90,000 | $70,600 |
| 2014 | $3,630 | $160,600 | $90,000 | $70,600 |
Source: Public Records
Map
Nearby Homes
- 5308 Atlantic Ave
- 5301 Atlantic Ave Unit D
- 5200 Atlantic Ave
- 311 E Hildreth Ave
- 305 E Bennett Ave Unit A
- 5407 Pacific Ave Unit 13
- 5100 Atlantic Ave
- 302 E Buttercup Rd Unit 6
- 302 E Buttercup Rd Unit 10
- 5301 Ocean Ave Unit 305 Wildwood Ocean T
- 5301 Ocean Ave Unit 506
- 238 E Leaming Ave
- 224 E Leaming Ave
- 5600 #23 Seaview Ave Unit 23
- 301 E Lavender Rd Unit 1 (A)
- 301 E Leaming Ave Unit F
- 5600 Seaview Ave Unit 34
- 5600 Seaview Ave Unit 8
- 5600 Seaview Ave
- 415 E Heather Rd Unit 202
- 241 E Cresse Ave Unit 3RD
- 241 E Cresse Ave Unit 3RD
- 241 E Cresse Ave Unit 2ND
- 241 E Cresse Ave Unit 1ST
- 241 E Cresse Ave Unit 3RD
- 241 E Cresse Ave Unit 3RD
- 241 E Cresse Ave Unit 2ND
- 241 E Cresse Ave Unit 1ST
- 241 E Cresse Ave Unit 4
- 241 E Cresse Ave Unit 2
- 241 E Cresse Ave Unit 7
- 241 E Cresse Ave Unit 1
- 241 E Cresse Ave Unit Firstfloor
- 241 E Cresse Ave Unit 3
- 241 E Cresse Ave
- 241 E Cresse Avenue #5 Unit 5
- 235 E Cresse Ave
- 245 E Cresse Ave
- 233 E Cresse Ave
- 5304 Atlantic Ave