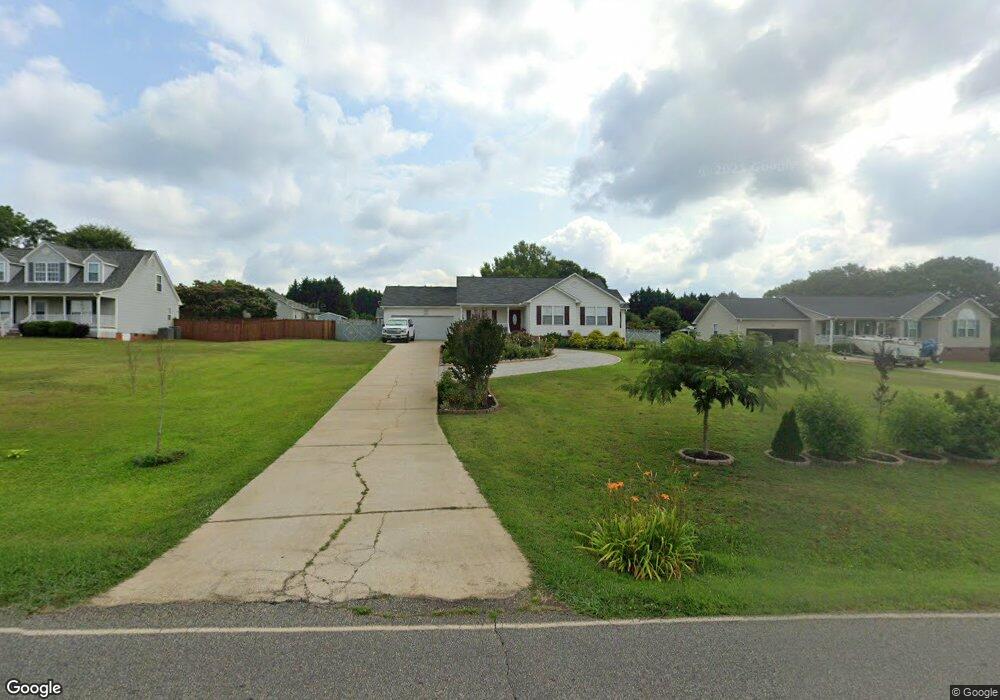
241 Gibbs Rd Wellford, SC 29385
Estimated Value: $278,677 - $312,000
3
Beds
2
Baths
1,502
Sq Ft
$201/Sq Ft
Est. Value
About This Home
This home is located at 241 Gibbs Rd, Wellford, SC 29385 and is currently estimated at $301,669, approximately $200 per square foot. 241 Gibbs Rd is a home located in Spartanburg County with nearby schools including Wellford Academy Of Science And Techology, James Byrnes Freshman Academy, and D.R. Hill Middle School.
Ownership History
Date
Name
Owned For
Owner Type
Purchase Details
Closed on
Oct 29, 2015
Sold by
Vechirko Dmitriy and Vechirko Marina
Bought by
Voznyuk Sergey and Voznyuk Lyubov
Current Estimated Value
Purchase Details
Closed on
Sep 6, 2007
Sold by
Residential Funding Co Llc
Bought by
Vechirko Dmitriy and Vechirko Marina
Home Financials for this Owner
Home Financials are based on the most recent Mortgage that was taken out on this home.
Original Mortgage
$103,450
Interest Rate
6.44%
Mortgage Type
Unknown
Purchase Details
Closed on
Mar 16, 2007
Sold by
Young Arlesia
Bought by
Residential Funding Co Llc
Purchase Details
Closed on
Jul 22, 2004
Sold by
Young Arlesia
Bought by
Homecomings Financial Network Inc
Purchase Details
Closed on
Nov 15, 2000
Sold by
J & L Investments Llc
Bought by
Young Arlesia
Create a Home Valuation Report for This Property
The Home Valuation Report is an in-depth analysis detailing your home's value as well as a comparison with similar homes in the area
Home Values in the Area
Average Home Value in this Area
Purchase History
| Date | Buyer | Sale Price | Title Company |
|---|---|---|---|
| Voznyuk Sergey | $134,500 | None Available | |
| Vechirko Dmitriy | $108,900 | None Available | |
| Residential Funding Co Llc | $500 | None Available | |
| Homecomings Financial Network Inc | $10,000 | -- | |
| Young Arlesia | $153,000 | -- |
Source: Public Records
Mortgage History
| Date | Status | Borrower | Loan Amount |
|---|---|---|---|
| Previous Owner | Vechirko Dmitriy | $103,450 |
Source: Public Records
Tax History Compared to Growth
Tax History
| Year | Tax Paid | Tax Assessment Tax Assessment Total Assessment is a certain percentage of the fair market value that is determined by local assessors to be the total taxable value of land and additions on the property. | Land | Improvement |
|---|---|---|---|---|
| 2025 | $1,320 | $7,115 | $1,197 | $5,918 |
| 2024 | $1,320 | $7,115 | $1,197 | $5,918 |
| 2023 | $1,320 | $7,115 | $1,197 | $5,918 |
| 2022 | $1,074 | $6,187 | $841 | $5,346 |
| 2021 | $1,521 | $6,187 | $841 | $5,346 |
| 2020 | $1,501 | $6,187 | $841 | $5,346 |
| 2019 | $1,498 | $6,187 | $841 | $5,346 |
| 2018 | $1,414 | $6,187 | $841 | $5,346 |
| 2017 | $1,237 | $5,380 | $880 | $4,500 |
| 2016 | $3,526 | $8,070 | $1,320 | $6,750 |
| 2015 | $888 | $3,864 | $880 | $2,984 |
| 2014 | $889 | $3,864 | $880 | $2,984 |
Source: Public Records
Map
Nearby Homes
- 335 Hillcove Point
- 734 New Ct S
- 726 New Ct S
- The Deerview Plan at Emerald Ridge
- The Pellum Plan at Emerald Ridge
- The Bishop Plan at Emerald Ridge
- The Belue Plan at Emerald Ridge
- The Hampton Plan at Emerald Ridge
- The Artic Plan at Emerald Ridge
- 730 New Ct S
- 738 New Ct S
- 742 New Ct S
- 231 Canady Rd
- 1735 Inman Rd
- 433 Analyse Dr
- 184 Half Moon Rd
- 0 Gibbs Rd Unit 293866
- 0 Gibbs Rd Unit 1481502
- 245 Rushing Waters Dr
- 214 Rushing Waters Dr
- 247 Gibbs Rd
- 410 Bollweevil Way
- 424 Bollweevil Way
- 253 Gibbs Rd
- 170 Elsie Hinson Ln
- 248 Gibbs Rd
- 258 Gibbs Rd
- 242 Gibbs Rd
- 252 Gibbs Rd
- 259 Gibbs Rd
- 434 Bollweevil Way
- 409 Bollweevil Way
- 262 Gibbs Rd
- 160 Elsie Hinson Ln
- 444 Bollweevil Way
- 165 Elsie Hinson Ln
- 270 Gibbs Rd
- 421 Bollweevil Way
- 428 Gibbs Rd
- 223 Gibbs Rd