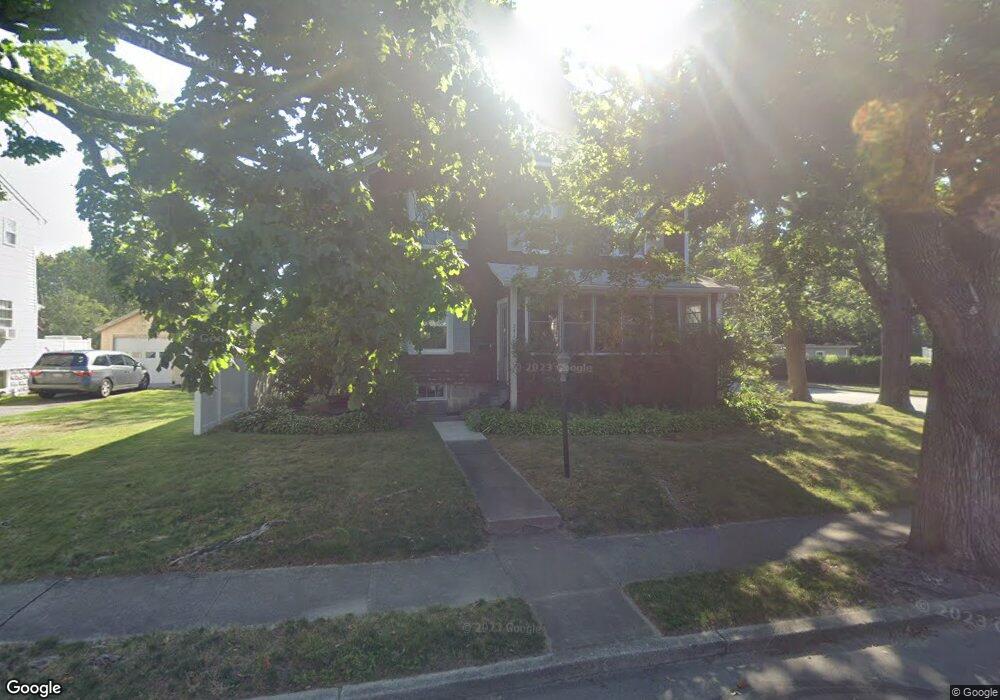
241 Green St Fairhaven, MA 02719
Oxford NeighborhoodEstimated Value: $524,000 - $667,000
4
Beds
2
Baths
1,704
Sq Ft
$344/Sq Ft
Est. Value
About This Home
This home is located at 241 Green St, Fairhaven, MA 02719 and is currently estimated at $585,715, approximately $343 per square foot. 241 Green St is a home located in Bristol County with nearby schools including Fairhaven High School, City On A Hill Charter Public School New Bedford, and St. Joseph School.
Ownership History
Date
Name
Owned For
Owner Type
Purchase Details
Closed on
Apr 21, 2009
Sold by
Vena H Dante
Bought by
Miglizzi Stephen J and Gilliam-Miglizzi Leslie S
Current Estimated Value
Home Financials for this Owner
Home Financials are based on the most recent Mortgage that was taken out on this home.
Original Mortgage
$270,019
Interest Rate
5.02%
Mortgage Type
Purchase Money Mortgage
Create a Home Valuation Report for This Property
The Home Valuation Report is an in-depth analysis detailing your home's value as well as a comparison with similar homes in the area
Home Values in the Area
Average Home Value in this Area
Purchase History
| Date | Buyer | Sale Price | Title Company |
|---|---|---|---|
| Miglizzi Stephen J | $275,000 | -- |
Source: Public Records
Mortgage History
| Date | Status | Borrower | Loan Amount |
|---|---|---|---|
| Open | Miglizzi Stephen J | $261,753 | |
| Closed | Miglizzi Stephen J | $270,019 | |
| Previous Owner | Miglizzi Stephen J | $79,000 | |
| Previous Owner | Miglizzi Stephen J | $23,000 |
Source: Public Records
Tax History Compared to Growth
Tax History
| Year | Tax Paid | Tax Assessment Tax Assessment Total Assessment is a certain percentage of the fair market value that is determined by local assessors to be the total taxable value of land and additions on the property. | Land | Improvement |
|---|---|---|---|---|
| 2025 | $36 | $390,100 | $183,600 | $206,500 |
| 2024 | $3,504 | $379,600 | $183,600 | $196,000 |
| 2023 | $3,519 | $353,700 | $170,200 | $183,500 |
| 2022 | $3,457 | $338,300 | $162,200 | $176,100 |
| 2021 | $3,301 | $292,400 | $147,400 | $145,000 |
| 2020 | $3,160 | $285,700 | $140,700 | $145,000 |
| 2019 | $5,404 | $261,800 | $128,100 | $133,700 |
| 2018 | $8,481 | $249,700 | $121,900 | $127,800 |
| 2017 | $5,523 | $242,000 | $121,900 | $120,100 |
| 2016 | $2,827 | $232,100 | $121,900 | $110,200 |
| 2015 | $2,797 | $230,200 | $121,900 | $108,300 |
Source: Public Records
Map
Nearby Homes