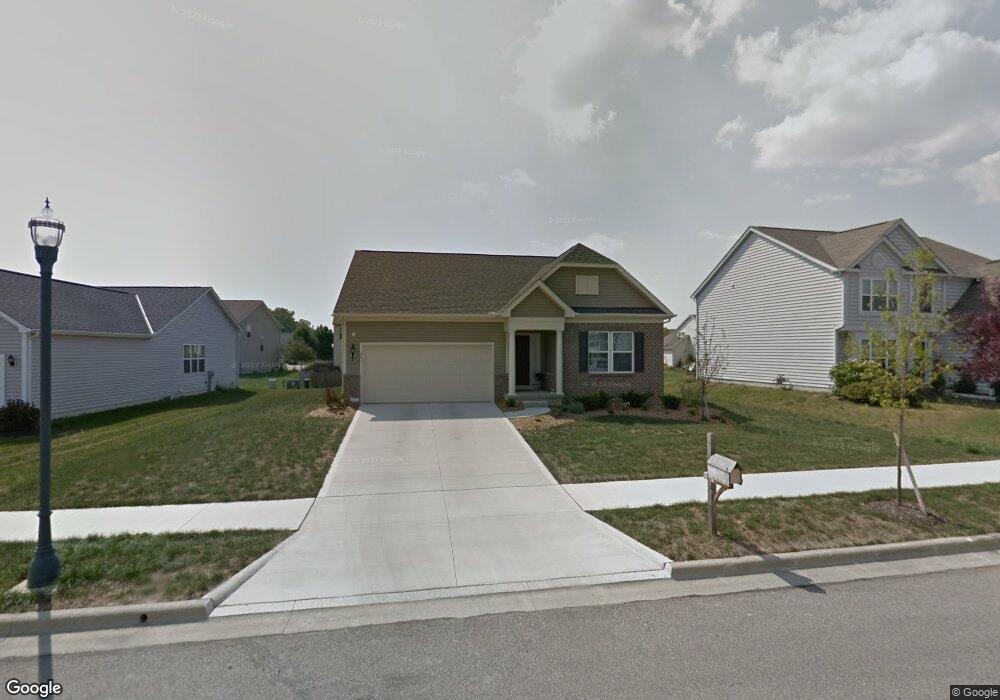
241 Harmony Dr Delaware, OH 43015
Estimated Value: $342,789 - $379,000
3
Beds
2
Baths
1,544
Sq Ft
$235/Sq Ft
Est. Value
About This Home
This home is located at 241 Harmony Dr, Delaware, OH 43015 and is currently estimated at $363,197, approximately $235 per square foot. 241 Harmony Dr is a home with nearby schools including Robert F. Schultz Elementary School, John C. Dempsey Middle School, and Rutherford B. Hayes High School.
Ownership History
Date
Name
Owned For
Owner Type
Purchase Details
Closed on
May 24, 2011
Sold by
Nvr Inc
Bought by
Forbes Desmond A and Forbes Marrilyn E
Current Estimated Value
Home Financials for this Owner
Home Financials are based on the most recent Mortgage that was taken out on this home.
Original Mortgage
$179,922
Interest Rate
4.87%
Mortgage Type
FHA
Purchase Details
Closed on
Apr 27, 2011
Sold by
Medrock Llc
Bought by
Nvr Inc and Ryan Homes
Home Financials for this Owner
Home Financials are based on the most recent Mortgage that was taken out on this home.
Original Mortgage
$179,922
Interest Rate
4.87%
Mortgage Type
FHA
Purchase Details
Closed on
Dec 9, 2005
Sold by
Albert Robert H
Bought by
Medrock Llc
Purchase Details
Closed on
Dec 7, 2005
Sold by
Medrock Llc
Bought by
Albert Robert H
Create a Home Valuation Report for This Property
The Home Valuation Report is an in-depth analysis detailing your home's value as well as a comparison with similar homes in the area
Home Values in the Area
Average Home Value in this Area
Purchase History
| Date | Buyer | Sale Price | Title Company |
|---|---|---|---|
| Forbes Desmond A | $184,700 | Nvr Title Agency Llc | |
| Nvr Inc | $25,900 | Nvr Title | |
| Medrock Llc | -- | None Available | |
| Albert Robert H | -- | None Available |
Source: Public Records
Mortgage History
| Date | Status | Borrower | Loan Amount |
|---|---|---|---|
| Previous Owner | Forbes Desmond A | $179,922 |
Source: Public Records
Tax History
| Year | Tax Paid | Tax Assessment Tax Assessment Total Assessment is a certain percentage of the fair market value that is determined by local assessors to be the total taxable value of land and additions on the property. | Land | Improvement |
|---|---|---|---|---|
| 2024 | $4,797 | $101,610 | $19,600 | $82,010 |
| 2023 | $4,806 | $101,610 | $19,600 | $82,010 |
| 2022 | $4,584 | $84,110 | $15,930 | $68,180 |
| 2021 | $4,686 | $84,110 | $15,930 | $68,180 |
| 2020 | $4,739 | $84,110 | $15,930 | $68,180 |
| 2019 | $4,415 | $71,020 | $12,250 | $58,770 |
| 2018 | $4,477 | $71,020 | $12,250 | $58,770 |
| 2017 | $4,024 | $62,480 | $11,200 | $51,280 |
| 2016 | $3,594 | $62,480 | $11,200 | $51,280 |
| 2015 | $3,614 | $62,480 | $11,200 | $51,280 |
| 2014 | $3,671 | $62,480 | $11,200 | $51,280 |
| 2013 | $3,692 | $62,480 | $11,200 | $51,280 |
Source: Public Records
Map
Nearby Homes
- 0 S Houk Rd
- 345 Lenell Loop
- 865 Canal St
- 69 Greenhedge Cir Unit 69
- 123 Schellinger St
- 440 Steeplechase St
- 183 Schellinger St
- 112 Silverline Dr
- 195 Lenell Loop
- 512 Lehner Woods Blvd
- 100 Quarry Ct
- 644 Lehner Woods Blvd
- 1723 S Section Line Rd
- 101 Franks Field Dr Unit Lot 13845
- 100 Gold Dust Ct
- 107 Franks Field Dr Unit Lot 13846
- 370 Little Creek Dr Unit 370
- 478 Penwell Dr Unit Lot 13903
- 181 Delaware Dr
- 233 Franks Field Dr Unit Lot 13880
- 247 Harmony Dr
- 235 Harmony Dr
- 114 Diverston Way
- 120 Diverston Way
- 253 Harmony Dr
- 242 Harmony Dr
- 223 Harmony Dr
- 108 Diverston Way
- 236 Harmony Dr
- 248 Harmony Dr
- 230 Harmony Dr
- 126 Diverston Way
- 254 Harmony Dr
- 224 Harmony Dr
- 217 Harmony Dr
- 259 Harmony Dr
- 132 Diverston Way
- 218 Harmony Dr
- 102 Diverston Way
- 455 Pagoda Loop
Your Personal Tour Guide
Ask me questions while you tour the home.