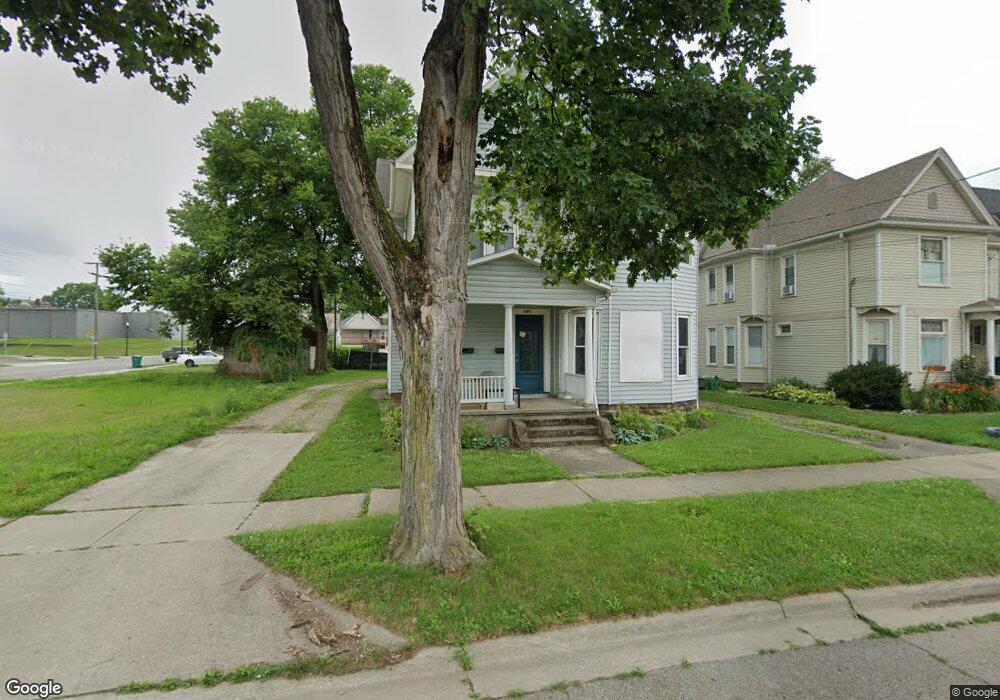
241 Hudson Ave Newark, OH 43055
Estimated Value: $120,000 - $196,264
3
Beds
2
Baths
1,908
Sq Ft
$83/Sq Ft
Est. Value
About This Home
This home is located at 241 Hudson Ave, Newark, OH 43055 and is currently estimated at $157,816, approximately $82 per square foot. 241 Hudson Ave is a home located in Licking County with nearby schools including Hillview Elementary School, Heritage Middle School, and Newark High School.
Ownership History
Date
Name
Owned For
Owner Type
Purchase Details
Closed on
Nov 21, 2017
Sold by
Boucher Philip J and Boucher Lisa L
Bought by
Boucher Chandler P
Current Estimated Value
Home Financials for this Owner
Home Financials are based on the most recent Mortgage that was taken out on this home.
Original Mortgage
$48,000
Outstanding Balance
$40,317
Interest Rate
3.94%
Mortgage Type
New Conventional
Estimated Equity
$117,499
Purchase Details
Closed on
Jan 29, 2001
Sold by
Holmes Cary J
Bought by
Boucher Philip J and Boucher Lisa L
Home Financials for this Owner
Home Financials are based on the most recent Mortgage that was taken out on this home.
Original Mortgage
$67,700
Interest Rate
7.43%
Mortgage Type
New Conventional
Purchase Details
Closed on
Nov 4, 1997
Sold by
Crumrine Donald W
Bought by
Holmes Cary J
Home Financials for this Owner
Home Financials are based on the most recent Mortgage that was taken out on this home.
Original Mortgage
$13,800
Interest Rate
9%
Mortgage Type
New Conventional
Create a Home Valuation Report for This Property
The Home Valuation Report is an in-depth analysis detailing your home's value as well as a comparison with similar homes in the area
Home Values in the Area
Average Home Value in this Area
Purchase History
| Date | Buyer | Sale Price | Title Company |
|---|---|---|---|
| Boucher Chandler P | $63,000 | None Available | |
| Boucher Philip J | $67,700 | -- | |
| Holmes Cary J | $69,000 | -- |
Source: Public Records
Mortgage History
| Date | Status | Borrower | Loan Amount |
|---|---|---|---|
| Open | Boucher Chandler P | $48,000 | |
| Previous Owner | Boucher Philip J | $67,700 | |
| Previous Owner | Holmes Cary J | $13,800 |
Source: Public Records
Tax History Compared to Growth
Tax History
| Year | Tax Paid | Tax Assessment Tax Assessment Total Assessment is a certain percentage of the fair market value that is determined by local assessors to be the total taxable value of land and additions on the property. | Land | Improvement |
|---|---|---|---|---|
| 2024 | $1,638 | $45,220 | $12,600 | $32,620 |
| 2023 | $1,635 | $45,220 | $12,600 | $32,620 |
| 2022 | $1,478 | $36,340 | $7,110 | $29,230 |
| 2021 | $1,550 | $36,340 | $7,110 | $29,230 |
| 2020 | $1,585 | $36,340 | $7,110 | $29,230 |
| 2019 | $1,270 | $28,390 | $5,920 | $22,470 |
| 2018 | $1,271 | $0 | $0 | $0 |
| 2017 | $1,249 | $0 | $0 | $0 |
| 2016 | $1,199 | $0 | $0 | $0 |
| 2015 | $612 | $0 | $0 | $0 |
| 2014 | $1,527 | $0 | $0 | $0 |
| 2013 | $1,222 | $0 | $0 | $0 |
Source: Public Records
Map
Nearby Homes
- 11 E Saint Clair St
- 0 Clinton St
- 191 Elmwood Ave
- 311 Clinton St
- 14 E Oak St
- 63 Chestnut St
- 355 Hudson Ave
- 69 Wallace St
- 247 Buckingham St
- 27 W North St
- 51 E North St
- 423 Hudson Ave
- 383 Central Ave
- 355 Eddy St
- 140 W Locust St
- 467 Mount Vernon Rd
- 23 Columbia St
- 333 N 10th St
- 137 Manning St
- 64 N 10th St
- 245 Hudson Ave
- 237 Hudson Ave
- 252 Elmwood Ave
- 257 Hudson Ave
- 256 Elmwood Ave
- 18 St Clair St
- 18 W Saint Clair St
- 260 Elmwood Ave
- 265 Hudson Ave
- 263 Hudson Ave
- 263 Hudson Ave Unit 263-265
- 242 Hudson Ave
- 248 Hudson Ave
- 257 Elmwood Ave
- 259 Elmwood Ave
- 267 Hudson Ave
- 260 Hudson Ave
- 255 Elmwood Ave Unit LOWER
- 255 Elmwood Ave Unit UPPER
- 255 Elmwood Ave