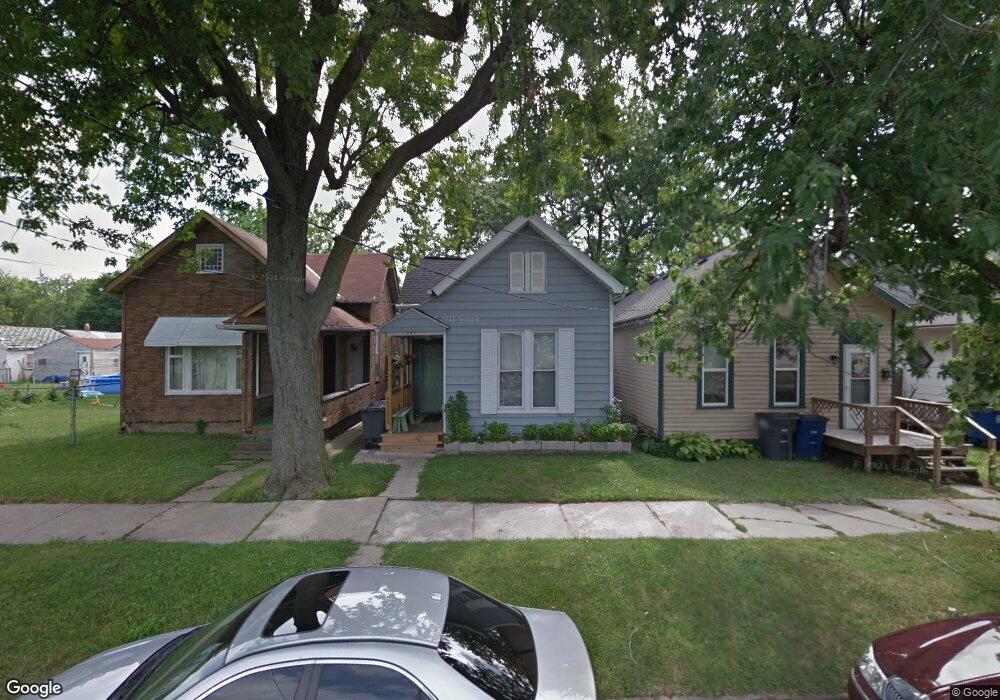
241 Langdon St Toledo, OH 43609
Southside NeighborhoodEstimated Value: $42,000 - $61,000
3
Beds
1
Bath
1,062
Sq Ft
$47/Sq Ft
Est. Value
About This Home
This home is located at 241 Langdon St, Toledo, OH 43609 and is currently estimated at $49,944, approximately $47 per square foot. 241 Langdon St is a home located in Lucas County with nearby schools including Marshall Stemm Academy, Jesup W. Scott High School, and Summit Academy - Toledo.
Ownership History
Date
Name
Owned For
Owner Type
Purchase Details
Closed on
Jul 25, 2014
Sold by
Nguyen Leena and Huynh Quang
Bought by
Moccabee Sam C
Current Estimated Value
Purchase Details
Closed on
Sep 10, 2007
Sold by
Nguyen Quendolynn H and Bui Edmond
Bought by
Nguyen Leena and Huynh Quang
Purchase Details
Closed on
Jun 10, 2002
Sold by
Annie Bui and Nguyen Annie
Bought by
Nguyen Quendolynn H
Purchase Details
Closed on
Apr 15, 1994
Sold by
Bui Nghia Trung and Bui Mydung
Create a Home Valuation Report for This Property
The Home Valuation Report is an in-depth analysis detailing your home's value as well as a comparison with similar homes in the area
Home Values in the Area
Average Home Value in this Area
Purchase History
We collect this data history from publicly available records. To have your information removed, we recommend requesting removal directly through your county’s website.
| Date | Buyer | Sale Price | Title Company |
|---|---|---|---|
| Moccabee Sam C | $10,200 | None Available | |
| Nguyen Leena | -- | Attorney | |
| Nguyen Quendolynn H | -- | -- | |
| -- | -- | -- |
Source: Public Records
Tax History
| Year | Tax Paid | Tax Assessment Tax Assessment Total Assessment is a certain percentage of the fair market value that is determined by local assessors to be the total taxable value of land and additions on the property. | Land | Improvement |
|---|---|---|---|---|
| 2025 | $2,394 | $6,475 | $1,505 | $4,970 |
| 2024 | $2,122 | $6,475 | $1,505 | $4,970 |
| 2023 | $489 | $6,370 | $1,575 | $4,795 |
| 2022 | $495 | $6,370 | $1,575 | $4,795 |
| 2021 | $498 | $6,370 | $1,575 | $4,795 |
| 2020 | $490 | $5,530 | $1,365 | $4,165 |
| 2019 | $486 | $5,530 | $1,365 | $4,165 |
| 2018 | $481 | $5,530 | $1,365 | $4,165 |
| 2017 | $499 | $5,390 | $1,330 | $4,060 |
| 2016 | $491 | $15,400 | $3,800 | $11,600 |
| 2015 | $484 | $15,400 | $3,800 | $11,600 |
| 2014 | $339 | $5,390 | $1,330 | $4,060 |
| 2013 | $339 | $5,390 | $1,330 | $4,060 |
Source: Public Records
Map
Nearby Homes
- 323 Langdon St
- 649 Curtis St
- 905 Walbridge Ave
- 911 Vinton St
- 964 Western Ave
- 641 South Ave
- 838 S Erie St
- 864 Colburn St
- 517 Knower St
- 442 Walbridge Ave
- 860 Prouty Ave
- 318 Courtland Ave
- 615 Prouty Ave
- 440 South Ave
- 434 South Ave
- 316 Eastern Ave
- 616 Thayer St
- 837 Orchard St
- 285 Walbridge Ave
- 710 Redwood Ave
Your Personal Tour Guide
Ask me questions while you tour the home.