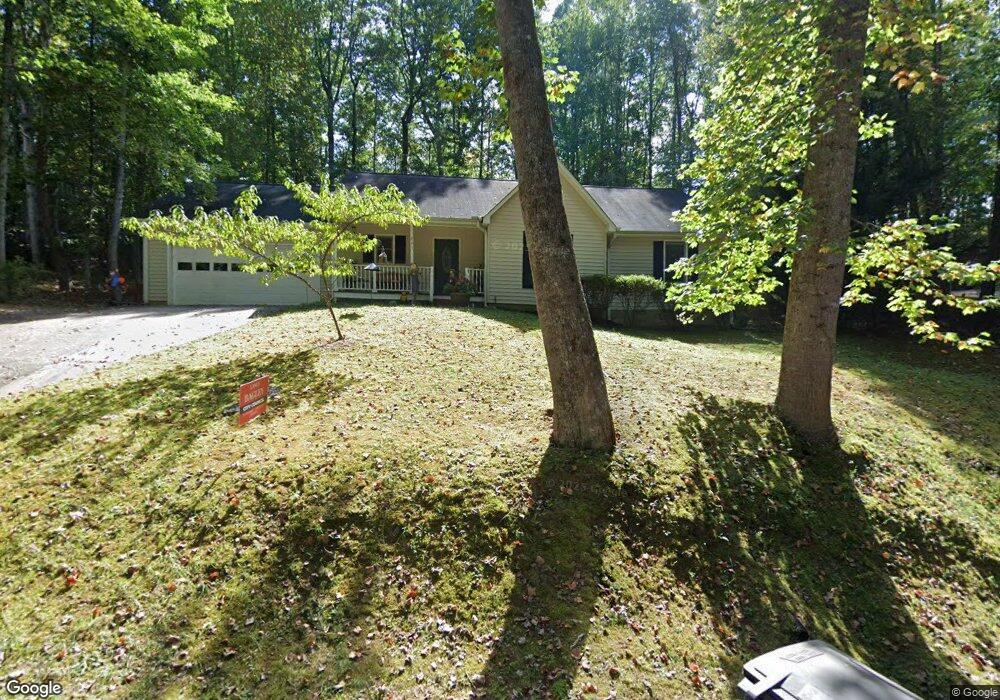
241 Laurel Heights Dr Dahlonega, GA 30533
Estimated Value: $306,000 - $357,000
--
Bed
2
Baths
1,456
Sq Ft
$223/Sq Ft
Est. Value
About This Home
This home is located at 241 Laurel Heights Dr, Dahlonega, GA 30533 and is currently estimated at $324,183, approximately $222 per square foot. 241 Laurel Heights Dr is a home located in Lumpkin County with nearby schools including Clay County Middle School and Lumpkin County High School.
Ownership History
Date
Name
Owned For
Owner Type
Purchase Details
Closed on
Mar 28, 2003
Sold by
Worick Christopher
Bought by
Worick Christopher and Monika Johanna
Current Estimated Value
Purchase Details
Closed on
Oct 21, 2002
Sold by
Unterwagner Darrick C
Bought by
Unterwagner Darrick C and Unterwagner Sunshine
Purchase Details
Closed on
Oct 16, 2002
Sold by
Johnson Roland Ray
Bought by
Unterwagner Darrick C
Purchase Details
Closed on
Nov 17, 1998
Sold by
Trout Betty
Bought by
Johnson Roland Ray
Purchase Details
Closed on
Oct 3, 1996
Sold by
Sunshine A
Bought by
Unterwagner Darrick
Purchase Details
Closed on
May 28, 1991
Sold by
Obrien Bobbie T
Bought by
Abee Jerry
Purchase Details
Closed on
Sep 5, 1989
Sold by
James T
Bought by
Obrien Bobbie T
Purchase Details
Closed on
Jan 1, 1987
Sold by
Maxwell Damas C
Bought by
O'Brien Bobbie T
Purchase Details
Closed on
Jun 1, 1980
Bought by
Maxwell Dumas C and Maxwell Debra
Create a Home Valuation Report for This Property
The Home Valuation Report is an in-depth analysis detailing your home's value as well as a comparison with similar homes in the area
Home Values in the Area
Average Home Value in this Area
Purchase History
| Date | Buyer | Sale Price | Title Company |
|---|---|---|---|
| Worick Christopher | -- | -- | |
| Worick Christopher | $125,000 | -- | |
| Unterwagner Darrick C | -- | -- | |
| Unterwagner Darrick C | -- | -- | |
| Johnson Roland Ray | $77,800 | -- | |
| Unterwagner Darrick | $84,000 | -- | |
| Abee Jerry | $8,300 | -- | |
| Obrien Bobbie T | -- | -- | |
| O'Brien Bobbie T | -- | -- | |
| Maxwell Dumas C | -- | -- |
Source: Public Records
Tax History Compared to Growth
Tax History
| Year | Tax Paid | Tax Assessment Tax Assessment Total Assessment is a certain percentage of the fair market value that is determined by local assessors to be the total taxable value of land and additions on the property. | Land | Improvement |
|---|---|---|---|---|
| 2024 | $2,361 | $86,428 | $10,000 | $76,428 |
| 2023 | $1,766 | $80,990 | $10,000 | $70,990 |
| 2022 | $2,061 | $69,170 | $8,420 | $60,750 |
| 2021 | $1,845 | $58,201 | $8,420 | $49,781 |
| 2020 | $1,865 | $56,698 | $8,420 | $48,278 |
| 2019 | $1,875 | $56,698 | $8,420 | $48,278 |
| 2018 | $1,789 | $50,811 | $8,420 | $42,391 |
| 2017 | $1,734 | $48,482 | $8,420 | $40,062 |
| 2016 | $1,628 | $44,664 | $8,420 | $36,244 |
| 2015 | $1,405 | $44,664 | $8,420 | $36,244 |
| 2014 | $1,405 | $45,100 | $8,420 | $36,681 |
| 2013 | -- | $45,537 | $8,419 | $37,117 |
Source: Public Records
Map
Nearby Homes
- 490 N Hall Rd
- 94 Mountain View Dr
- 399 N Chestatee St
- 97 Beaumont Dr
- 253 Blair Ridge Rd
- 95 Jones St
- 120 Blair Ridge Rd
- 22 Honeysuckle Ln
- 121 Blair Ridge Rd
- 315 Church St
- 502 Wimpy Mill Rd
- 168 W Main St
- 0 Highway 19 N Unit 10594984
- 132 J Mountain Dr
- 0 S Chestatee St Unit 10619536
- 0 Dawsonville Hwy Unit 10631159
- 00 Dawsonville Hwy
- 549 Ivy Terrace
- 159 Misty Way
- 1202 Oak Grove Rd
- 362 Skyline Dr
- 281 Laurel Heights Dr
- 207 Laurel Heights Dr
- 244 Laurel Heights Dr
- 374 Skyline Dr
- 324 Skyline Dr
- 0 Skyline Dr Unit 7462207
- 0 Skyline Dr Unit 8813750
- 0 Skyline Dr Unit 7600199
- 402 Skyline Dr
- 422 Skyline Dr
- 183 Laurel Heights Dr
- 367 Skyline Dr
- 341 Skyline Dr
- 224 Laurel Heights Dr
- 397 Skyline Dr
- 177 Kenimer Dr
- 292 Skyline Dr
- 430 Skyline Dr
- 145 Laurel Heights Dr