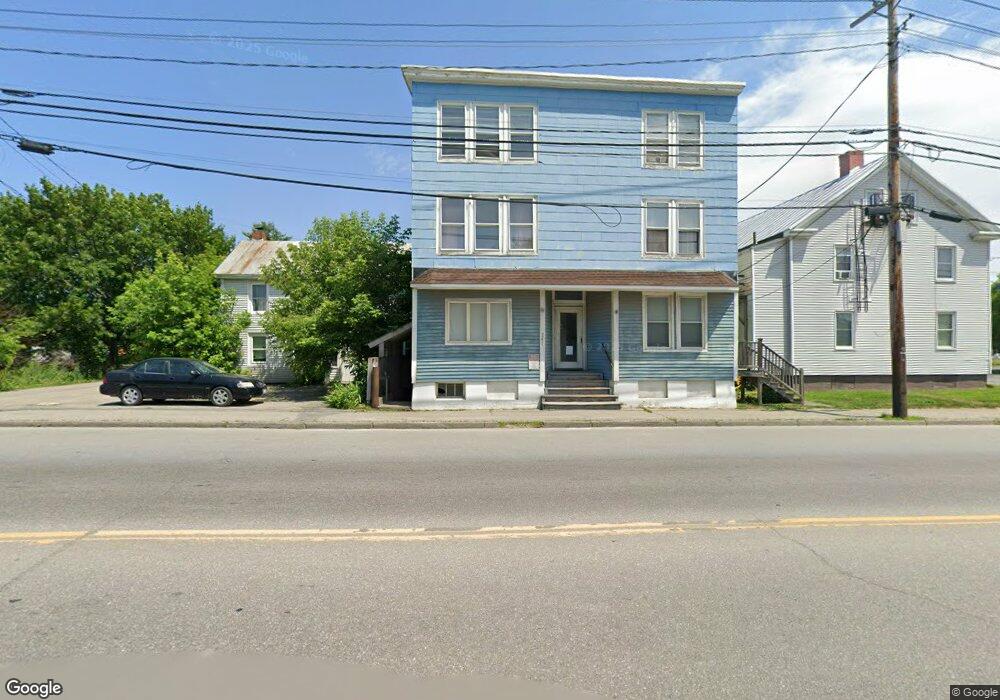
241 Main St Waterville, ME 04901
--
Bed
11
Baths
9,081
Sq Ft
0.4
Acres
About This Home
This home is located at 241 Main St, Waterville, ME 04901. 241 Main St is a home located in Kennebec County with nearby schools including George J. Mitchell School, Albert S. Hall School, and Waterville Junior High School.
Create a Home Valuation Report for This Property
The Home Valuation Report is an in-depth analysis detailing your home's value as well as a comparison with similar homes in the area
Home Values in the Area
Average Home Value in this Area
Tax History
| Year | Tax Paid | Tax Assessment Tax Assessment Total Assessment is a certain percentage of the fair market value that is determined by local assessors to be the total taxable value of land and additions on the property. | Land | Improvement |
|---|---|---|---|---|
| 2025 | $7,710 | $453,500 | $58,100 | $395,400 |
| 2024 | $5,610 | $280,500 | $89,000 | $191,500 |
| 2023 | $5,582 | $280,500 | $89,000 | $191,500 |
| 2022 | $3,983 | $154,100 | $50,600 | $103,500 |
| 2021 | $3,930 | $154,100 | $50,600 | $103,500 |
| 2020 | $3,970 | $154,100 | $50,600 | $103,500 |
| 2019 | $3,970 | $154,100 | $50,600 | $103,500 |
| 2018 | $3,894 | $154,100 | $50,600 | $103,500 |
| 2017 | $3,595 | $154,100 | $50,600 | $103,500 |
| 2016 | $3,513 | $154,100 | $50,600 | $103,500 |
| 2015 | $4,451 | $160,100 | $58,000 | $102,100 |
| 2014 | $4,387 | $160,100 | $58,000 | $102,100 |
| 2013 | $4,387 | $160,100 | $58,000 | $102,100 |
Source: Public Records
Map
Nearby Homes
Your Personal Tour Guide
Ask me questions while you tour the home.