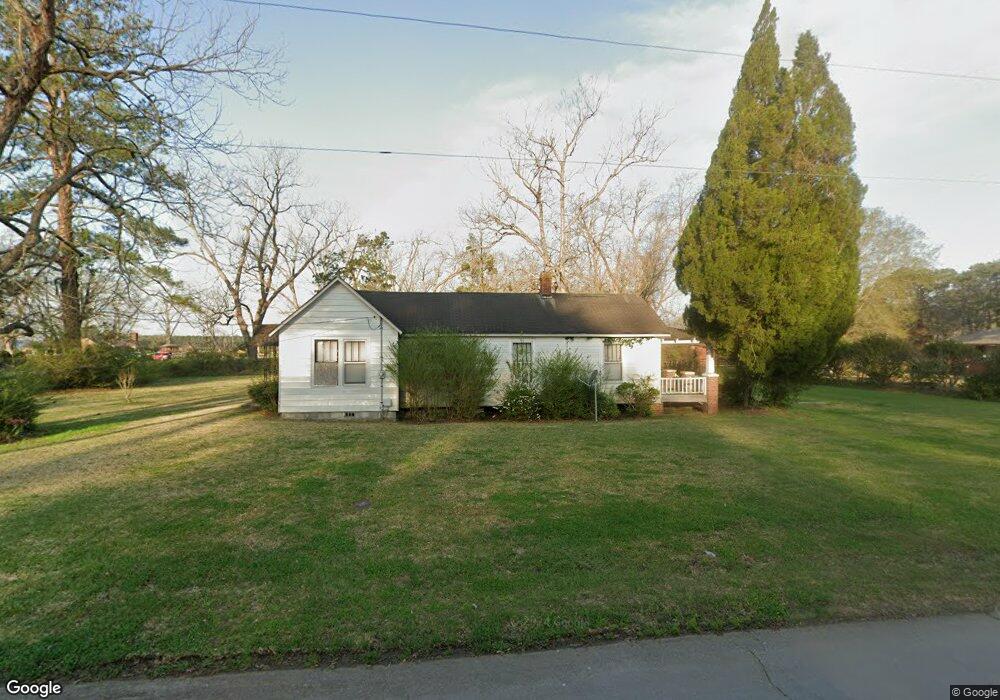
241 N 7th St Aurora, NC 27806
Estimated Value: $91,000 - $393,052
2
Beds
2
Baths
1,020
Sq Ft
$243/Sq Ft
Est. Value
About This Home
This home is located at 241 N 7th St, Aurora, NC 27806 and is currently estimated at $248,263, approximately $243 per square foot. 241 N 7th St is a home with nearby schools including S.W. Snowden Elementary School and Southside High School.
Ownership History
Date
Name
Owned For
Owner Type
Purchase Details
Closed on
Jan 13, 2026
Sold by
Pcs Phosphate Company Inc
Bought by
W B Thompson Holdings Llc
Current Estimated Value
Purchase Details
Closed on
Aug 2, 2024
Sold by
Cherry Donna B
Bought by
Pcs Phosphate Company Inc
Purchase Details
Closed on
Jul 30, 2024
Sold by
Broome Bart S and Broome Regina Ronald
Bought by
Pcs Phosphate Company Inc
Purchase Details
Closed on
Jul 29, 2024
Sold by
Broome William R H and Broome Linda O
Bought by
Pcs Phosphate Company Inc
Purchase Details
Closed on
Jul 23, 2024
Sold by
Fraune Carol B and Fraune Anthony T
Bought by
Pcs Phosphate Company Inc
Purchase Details
Closed on
Jul 8, 2024
Sold by
Fulcher Marvin L and Fulcher Joyce
Bought by
Pcs Phosphate Company Inc
Purchase Details
Closed on
Jun 27, 2024
Sold by
Lee Bowen Michael and Herring Dean
Bought by
Pcs Phosphate Company Inc
Purchase Details
Closed on
Oct 29, 2018
Bought by
Youmans William Augustus
Purchase Details
Closed on
Nov 14, 2005
Bought by
Broome Stephen White
Create a Home Valuation Report for This Property
The Home Valuation Report is an in-depth analysis detailing your home's value as well as a comparison with similar homes in the area
Home Values in the Area
Average Home Value in this Area
Purchase History
| Date | Buyer | Sale Price | Title Company |
|---|---|---|---|
| W B Thompson Holdings Llc | $14,500 | None Listed On Document | |
| Pcs Phosphate Company Inc | $1,000 | None Listed On Document | |
| Pcs Phosphate Company Inc | $1,000 | None Listed On Document | |
| Pcs Phosphate Company Inc | $1,000 | None Listed On Document | |
| Pcs Phosphate Company Inc | $1,000 | None Listed On Document | |
| Pcs Phosphate Company Inc | $1,000 | None Listed On Document | |
| Pcs Phosphate Company Inc | $1,000 | None Listed On Document | |
| Youmans William Augustus | $272,500 | -- | |
| Broome Stephen White | -- | -- |
Source: Public Records
Tax History
| Year | Tax Paid | Tax Assessment Tax Assessment Total Assessment is a certain percentage of the fair market value that is determined by local assessors to be the total taxable value of land and additions on the property. | Land | Improvement |
|---|---|---|---|---|
| 2025 | $661 | $52,578 | $14,134 | $38,444 |
| 2024 | $464 | $22,022 | $8,268 | $13,754 |
| 2023 | $454 | $22,022 | $8,268 | $13,754 |
| 2022 | $449 | $22,022 | $8,268 | $13,754 |
| 2021 | $444 | $22,022 | $8,268 | $13,754 |
| 2020 | $441 | $22,022 | $8,268 | $13,754 |
| 2019 | $431 | $22,022 | $8,268 | $13,754 |
| 2018 | $3,100 | $22,022 | $8,268 | $13,754 |
| 2017 | $3,100 | $24,040 | $8,268 | $15,772 |
| 2016 | -- | $24,040 | $8,268 | $15,772 |
| 2015 | $90 | $0 | $0 | $0 |
| 2014 | $90 | $0 | $0 | $0 |
| 2013 | -- | $24,040 | $8,268 | $15,772 |
Source: Public Records
Map
Nearby Homes
- 225 N 6th St
- 267 S 6th St
- 207 N 5th St
- 288 S 5th St
- Nc-306
- 351 S 7th St
- Reid 25181 Main
- 672 Main St
- 260 Pearl St
- 00 N Carolina 306
- 25264 2nd St
- 0 State Road 1918
- 905 Dublin Run Rd
- 2717 Idalia Rd
- 0 Spring Creek Rd Unit 25873623
- 0 Creekmur Rd Unit 100531497
- 0 Creekmur Rd
- 17/17a Oregon
- 572 Main Street Extension
- 0 Sr 1932 Off
Your Personal Tour Guide
Ask me questions while you tour the home.