Estimated Value: $504,810 - $554,000
4
Beds
3
Baths
3,338
Sq Ft
$161/Sq Ft
Est. Value
About This Home
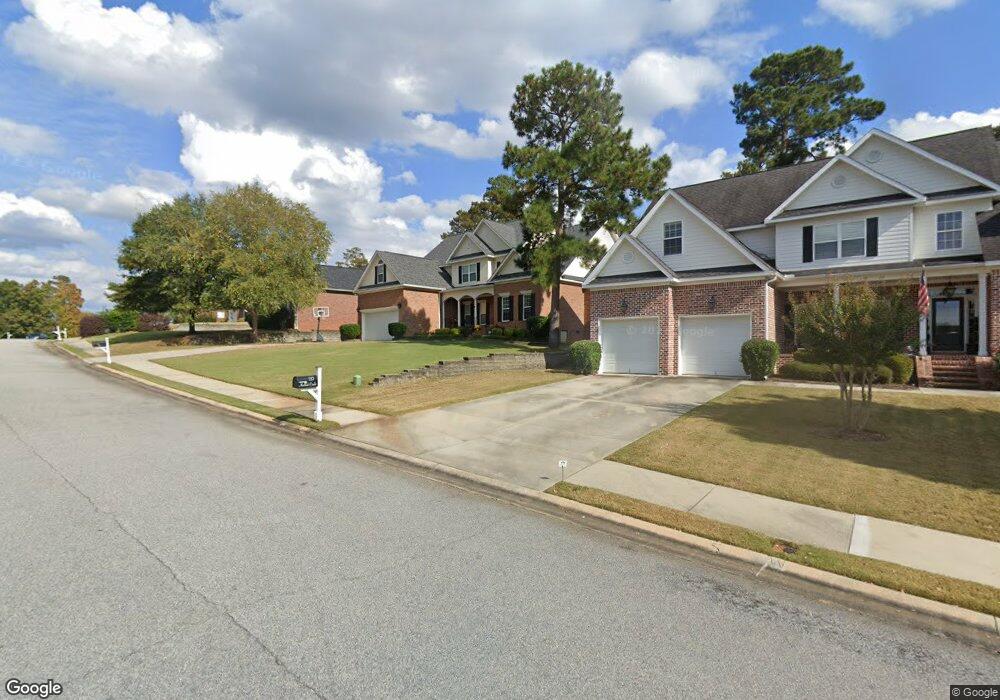
This home is located at 241 Newland Cir, Evans, GA 30809 and is currently estimated at $537,703, approximately $161 per square foot. 241 Newland Cir is a home located in Columbia County with nearby schools including The Conservatory School at North Palm Beach, Greenbrier Elementary School, and Hodge Elementary School.
Ownership History
Date
Name
Owned For
Owner Type
Purchase Details
Closed on
May 11, 2012
Sold by
Kelso David Andrew
Bought by
Horton William K
Current Estimated Value
Home Financials for this Owner
Home Financials are based on the most recent Mortgage that was taken out on this home.
Original Mortgage
$274,725
Outstanding Balance
$188,317
Interest Rate
3.75%
Mortgage Type
FHA
Estimated Equity
$349,386
Purchase Details
Closed on
Aug 16, 2006
Sold by
Situ Xiufang
Bought by
Kelso David A
Home Financials for this Owner
Home Financials are based on the most recent Mortgage that was taken out on this home.
Original Mortgage
$264,000
Interest Rate
5.63%
Mortgage Type
New Conventional
Purchase Details
Closed on
Jul 7, 2004
Sold by
Ernie Blackburn Homebuilders Llc
Bought by
Situ Xiufang and Jiang Xianghong
Home Financials for this Owner
Home Financials are based on the most recent Mortgage that was taken out on this home.
Original Mortgage
$271,985
Interest Rate
6.25%
Mortgage Type
Unknown
Create a Home Valuation Report for This Property
The Home Valuation Report is an in-depth analysis detailing your home's value as well as a comparison with similar homes in the area
Home Values in the Area
Average Home Value in this Area
Purchase History
| Date | Buyer | Sale Price | Title Company |
|---|---|---|---|
| Horton William K | $280,000 | -- | |
| Kelso David A | $330,000 | -- | |
| Situ Xiufang | $286,300 | -- |
Source: Public Records
Mortgage History
| Date | Status | Borrower | Loan Amount |
|---|---|---|---|
| Open | Horton William K | $274,725 | |
| Previous Owner | Kelso David A | $264,000 | |
| Previous Owner | Situ Xiufang | $271,985 |
Source: Public Records
Tax History Compared to Growth
Tax History
| Year | Tax Paid | Tax Assessment Tax Assessment Total Assessment is a certain percentage of the fair market value that is determined by local assessors to be the total taxable value of land and additions on the property. | Land | Improvement |
|---|---|---|---|---|
| 2025 | $4,726 | $195,748 | $33,404 | $162,344 |
| 2024 | $4,660 | $184,225 | $28,804 | $155,421 |
| 2023 | $4,660 | $172,893 | $28,804 | $144,089 |
| 2022 | $4,151 | $157,529 | $26,504 | $131,025 |
| 2021 | $4,003 | $145,112 | $23,104 | $122,008 |
| 2020 | $3,906 | $138,606 | $22,304 | $116,302 |
| 2019 | $3,752 | $133,061 | $21,204 | $111,857 |
| 2018 | $3,666 | $129,516 | $21,604 | $107,912 |
| 2017 | $3,558 | $125,196 | $19,504 | $105,692 |
| 2016 | $3,309 | $120,602 | $19,080 | $101,522 |
| 2015 | $3,342 | $121,630 | $18,980 | $102,650 |
| 2014 | $3,214 | $115,426 | $18,980 | $96,446 |
Source: Public Records
Map
Nearby Homes
- 502 Northlands Ln
- 410 Armstrong Way
- 129 Pond View Rd
- 422 Armstrong Way
- 460 Armstrong Way
- 929 Mitchell Ln
- 2303 Amberley Pass
- 333 Buxton Ln
- 510 Jutland Way
- 393 Sandleton Way
- 520 Jutland Way
- 987 Mitchell Ln
- 1005 Mitchell Ln
- 317 Colonnades Dr
- 508 Windermere St
- 4025 Dewaal St
- 4027 Dewaal St
- 6306 Southbroom Dr
- 422 Kirkwood Dr
- 451 Kirkwood Dr
- 243 Newland Cir
- 237 Newland Cir
- 245 Newland Cir
- 235 Newland Cir
- 708 Brownsfield Ln
- 706 Brownsfield Ln
- 238 Newland Cir
- 240 Newland Cir
- 247 Newland Cir
- 242 Newland Cir
- 704 Brownsfield Ln
- 234 Newland Cir
- 712 Brownsfield Ln
- 227 Newland Cir
- 244 Newland Cir
- 249 Newland Cir
- 702 Brownsfield Ln
- 232 Newland Cir
- 714 Brownsfield Ln
- 405 Armstrong Way