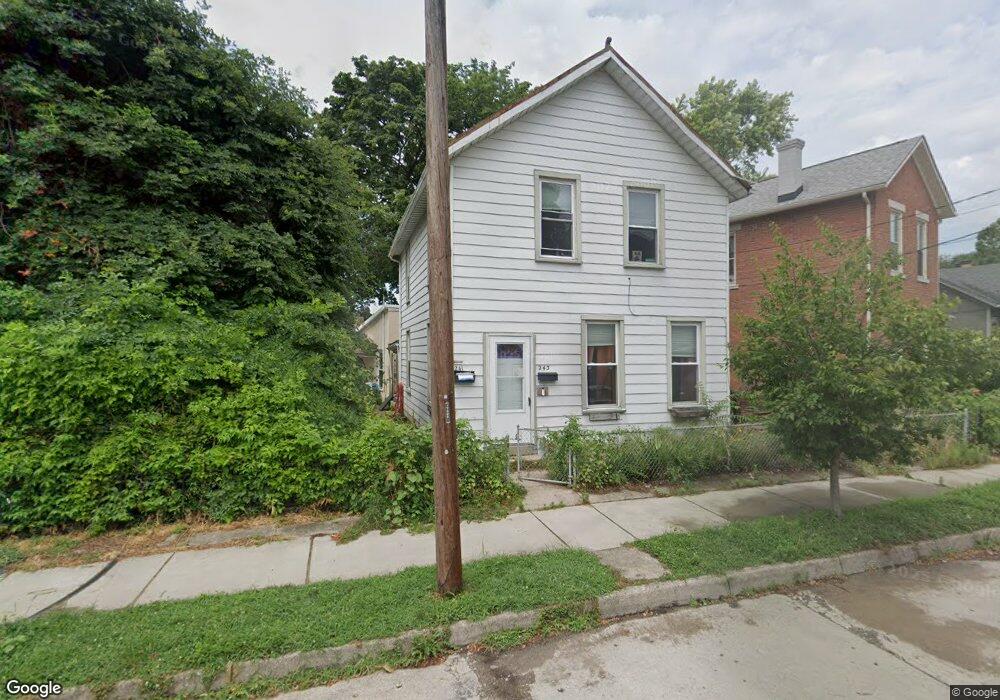
241 Oak St Dayton, OH 45410
South Park NeighborhoodEstimated Value: $152,811 - $330,000
4
Beds
3
Baths
1,966
Sq Ft
$112/Sq Ft
Est. Value
About This Home
This home is located at 241 Oak St, Dayton, OH 45410 and is currently estimated at $220,703, approximately $112 per square foot. 241 Oak St is a home located in Montgomery County with nearby schools including Ruskin Elementary School, Kiser Elementary, and Emerson Academy.
Ownership History
Date
Name
Owned For
Owner Type
Purchase Details
Closed on
Jan 2, 2017
Sold by
Logel Gary Lee and Logel Pamela Lynn
Bought by
Booth Rachel L
Current Estimated Value
Purchase Details
Closed on
Oct 15, 2014
Sold by
Logel Gary Lee and Logel Pamela Lynn
Bought by
Peterson Jeffrey B
Home Financials for this Owner
Home Financials are based on the most recent Mortgage that was taken out on this home.
Original Mortgage
$36,350
Interest Rate
3.77%
Mortgage Type
Seller Take Back
Purchase Details
Closed on
Apr 13, 1998
Sold by
Parker Orville E and Lee Fred
Bought by
Logel Gary Lee and Logel Pamela Lynn
Create a Home Valuation Report for This Property
The Home Valuation Report is an in-depth analysis detailing your home's value as well as a comparison with similar homes in the area
Home Values in the Area
Average Home Value in this Area
Purchase History
| Date | Buyer | Sale Price | Title Company |
|---|---|---|---|
| Booth Rachel L | $55,000 | None Available | |
| Peterson Jeffrey B | $55,000 | Attorney | |
| Logel Gary Lee | $36,000 | -- | |
| Logel Gary Lee | $36,000 | -- |
Source: Public Records
Mortgage History
| Date | Status | Borrower | Loan Amount |
|---|---|---|---|
| Previous Owner | Peterson Jeffrey B | $36,350 |
Source: Public Records
Tax History
| Year | Tax Paid | Tax Assessment Tax Assessment Total Assessment is a certain percentage of the fair market value that is determined by local assessors to be the total taxable value of land and additions on the property. | Land | Improvement |
|---|---|---|---|---|
| 2025 | $2,220 | $36,830 | $8,900 | $27,930 |
| 2024 | $2,133 | $36,830 | $8,900 | $27,930 |
| 2023 | $2,133 | $36,830 | $8,900 | $27,930 |
| 2022 | $1,663 | $22,270 | $5,390 | $16,880 |
| 2021 | $1,654 | $22,270 | $5,390 | $16,880 |
| 2020 | $1,642 | $22,270 | $5,390 | $16,880 |
| 2019 | $1,774 | $21,790 | $4,900 | $16,890 |
| 2018 | $1,777 | $21,790 | $4,900 | $16,890 |
| 2017 | $1,763 | $21,790 | $4,900 | $16,890 |
| 2016 | $2,038 | $23,840 | $4,900 | $18,940 |
| 2015 | $1,908 | $23,840 | $4,900 | $18,940 |
| 2014 | $1,908 | $23,840 | $4,900 | $18,940 |
| 2012 | -- | $19,290 | $4,790 | $14,500 |
Source: Public Records
Map
Nearby Homes
Your Personal Tour Guide
Ask me questions while you tour the home.