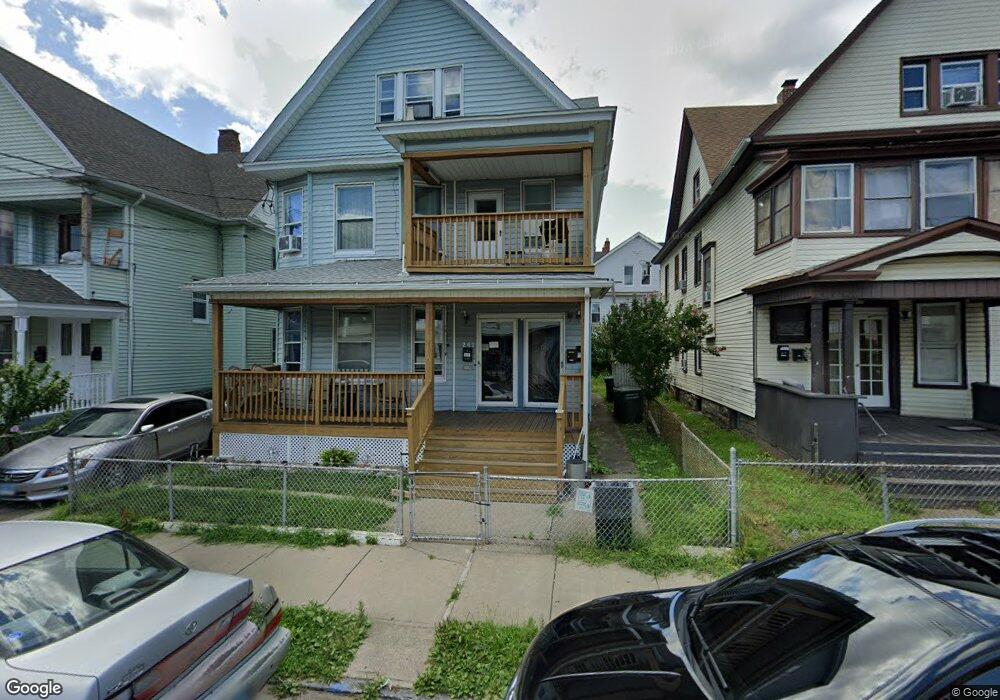
241 Orchard St Unit 243 Bridgeport, CT 06608
East Side Bridgeport NeighborhoodEstimated Value: $488,504 - $661,000
6
Beds
3
Baths
3,286
Sq Ft
$179/Sq Ft
Est. Value
About This Home
This home is located at 241 Orchard St Unit 243, Bridgeport, CT 06608 and is currently estimated at $588,876, approximately $179 per square foot. 241 Orchard St Unit 243 is a home located in Fairfield County with nearby schools including Luis Munoz Marin School, Harding High School, and Achievement First Bridgeport Academy Elementary School.
Ownership History
Date
Name
Owned For
Owner Type
Purchase Details
Closed on
Sep 17, 2020
Sold by
Vega Edwin and Vega Maribel
Bought by
Dolnier Timothy K and Picheco Michael J
Current Estimated Value
Purchase Details
Closed on
Mar 8, 2016
Sold by
Rodriguez Felix and Rodriguez Fenilda
Bought by
Vega Edwin and Vega Maribel
Home Financials for this Owner
Home Financials are based on the most recent Mortgage that was taken out on this home.
Original Mortgage
$80,000
Interest Rate
3.81%
Mortgage Type
New Conventional
Purchase Details
Closed on
Aug 14, 1987
Sold by
Figlar Andrew
Bought by
Rodriquez Felix
Home Financials for this Owner
Home Financials are based on the most recent Mortgage that was taken out on this home.
Original Mortgage
$109,000
Interest Rate
10.4%
Mortgage Type
Purchase Money Mortgage
Create a Home Valuation Report for This Property
The Home Valuation Report is an in-depth analysis detailing your home's value as well as a comparison with similar homes in the area
Home Values in the Area
Average Home Value in this Area
Purchase History
| Date | Buyer | Sale Price | Title Company |
|---|---|---|---|
| Dolnier Timothy K | $324,000 | None Available | |
| Dolnier Timothy K | $324,000 | None Available | |
| Vega Edwin | -- | -- | |
| Vega Edwin | -- | -- | |
| Rodriquez Felix | $82,000 | -- |
Source: Public Records
Mortgage History
| Date | Status | Borrower | Loan Amount |
|---|---|---|---|
| Previous Owner | Rodriquez Felix | $80,000 | |
| Previous Owner | Rodriquez Felix | $109,000 |
Source: Public Records
Tax History Compared to Growth
Tax History
| Year | Tax Paid | Tax Assessment Tax Assessment Total Assessment is a certain percentage of the fair market value that is determined by local assessors to be the total taxable value of land and additions on the property. | Land | Improvement |
|---|---|---|---|---|
| 2025 | $7,536 | $173,450 | $37,840 | $135,610 |
| 2024 | $7,536 | $173,450 | $37,840 | $135,610 |
| 2023 | $7,536 | $173,450 | $37,840 | $135,610 |
| 2022 | $7,536 | $173,450 | $37,840 | $135,610 |
| 2021 | $7,536 | $173,450 | $37,840 | $135,610 |
| 2020 | $7,037 | $130,330 | $17,920 | $112,410 |
| 2019 | $7,037 | $130,330 | $17,920 | $112,410 |
| 2018 | $7,086 | $130,330 | $17,920 | $112,410 |
| 2017 | $7,086 | $130,330 | $17,920 | $112,410 |
| 2016 | $7,086 | $130,330 | $17,920 | $112,410 |
| 2015 | $7,776 | $184,270 | $34,690 | $149,580 |
| 2014 | $7,776 | $184,270 | $34,690 | $149,580 |
Source: Public Records
Map
Nearby Homes
- 148 Orchard St
- 1218 Kossuth St
- 502 Berkshire Ave
- 50 Goddard Ave
- 438 Park St
- 110 Asylum St
- 1248 Pembroke St
- 105 Asylum St
- 291 Stillman St
- 1014 Noble Ave
- 369 Park St
- 399 Jane St
- 274 Park St
- 202 Goddard Ave
- 263 Brooks St
- 300 Beach St
- 530 Jane St
- 957 William St Unit A
- 604 William St
- 199 Bradley St Unit 203
- 235 Orchard St Unit 237
- 225-227 Orchard St
- 225 Orchard St Unit 227
- 247 Orchard St Unit 249
- 270 Pearl St
- 219-221 Orchard St Unit 3
- 219-221 Orchard St Unit 2
- 219 Orchard St Unit 221
- 242 Orchard St Unit 244
- 226 Orchard St Unit 228
- 234 Orchard St Unit 236
- 218 Orchard St Unit 220
- 250 Orchard St Unit 252
- 636 Brooks St Unit 638
- 413 Putnam St Unit 415
- 644 Brooks St Unit 646
- 644 Brooks St
- 644 Brooks St Unit 3
- 644 Brooks St Unit 2
- 644 Brooks St Unit 1