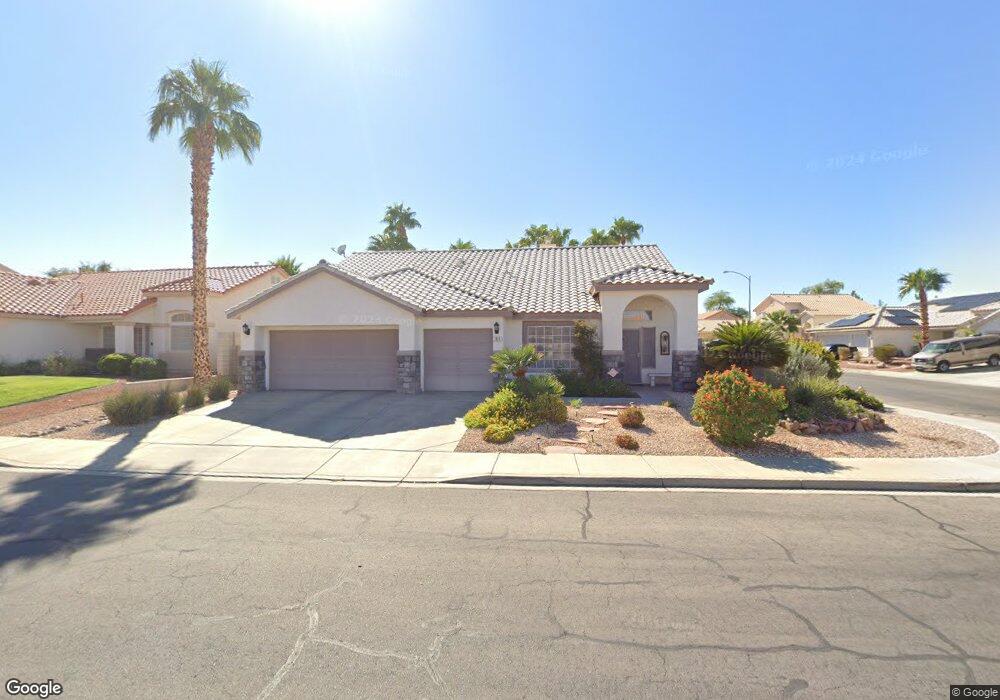
241 Paradise Bird St Unit 6B Henderson, NV 89074
Gibson Springs NeighborhoodEstimated Value: $539,000 - $580,000
4
Beds
2
Baths
2,130
Sq Ft
$258/Sq Ft
Est. Value
About This Home
This home is located at 241 Paradise Bird St Unit 6B, Henderson, NV 89074 and is currently estimated at $549,414, approximately $257 per square foot. 241 Paradise Bird St Unit 6B is a home located in Clark County with nearby schools including Lorna J Kesterson Elementary School, Lyal Burkholder Middle School, and Foothill High School.
Ownership History
Date
Name
Owned For
Owner Type
Purchase Details
Closed on
Oct 12, 2004
Sold by
Hedges George R and Hedges Sharon S
Bought by
Hedges George R and Hedges Sharon S
Current Estimated Value
Purchase Details
Closed on
Jul 26, 2001
Sold by
Demint Anthony N and Stoecklein Gisela A
Bought by
Hedges George R and Hedges Sharon S
Home Financials for this Owner
Home Financials are based on the most recent Mortgage that was taken out on this home.
Original Mortgage
$195,000
Interest Rate
7.09%
Purchase Details
Closed on
Feb 10, 1999
Sold by
Gibson Ranch Ltd Liability Company
Bought by
Demint Anthony N and Stoecklein Gisela A
Home Financials for this Owner
Home Financials are based on the most recent Mortgage that was taken out on this home.
Original Mortgage
$171,000
Interest Rate
6.79%
Create a Home Valuation Report for This Property
The Home Valuation Report is an in-depth analysis detailing your home's value as well as a comparison with similar homes in the area
Home Values in the Area
Average Home Value in this Area
Purchase History
| Date | Buyer | Sale Price | Title Company |
|---|---|---|---|
| Hedges George R | -- | -- | |
| Hedges George R | $245,000 | First American Title Co | |
| Demint Anthony N | $176,500 | National Title Company |
Source: Public Records
Mortgage History
| Date | Status | Borrower | Loan Amount |
|---|---|---|---|
| Closed | Hedges George R | $195,000 | |
| Previous Owner | Demint Anthony N | $171,000 |
Source: Public Records
Tax History Compared to Growth
Tax History
| Year | Tax Paid | Tax Assessment Tax Assessment Total Assessment is a certain percentage of the fair market value that is determined by local assessors to be the total taxable value of land and additions on the property. | Land | Improvement |
|---|---|---|---|---|
| 2025 | $2,544 | $132,807 | $41,300 | $91,507 |
| 2024 | $2,470 | $132,807 | $41,300 | $91,507 |
| 2023 | $2,470 | $124,323 | $37,975 | $86,348 |
| 2022 | $2,398 | $108,816 | $29,400 | $79,416 |
| 2021 | $2,329 | $104,190 | $28,700 | $75,490 |
| 2020 | $2,258 | $102,919 | $28,000 | $74,919 |
| 2019 | $2,192 | $98,601 | $24,850 | $73,751 |
| 2018 | $2,128 | $92,193 | $21,000 | $71,193 |
| 2017 | $2,652 | $91,495 | $19,250 | $72,245 |
| 2016 | $2,016 | $87,725 | $14,350 | $73,375 |
| 2015 | $2,011 | $67,340 | $11,550 | $55,790 |
| 2014 | $1,952 | $72,779 | $9,100 | $63,679 |
Source: Public Records
Map
Nearby Homes
- 1107 Cloudy Day Dr
- 228 Heaven Sent Ct
- 227 November Sky St
- 233 Leaf Bud Ct
- 268 Copper Glow Ct
- 1146 Light Sky Ave
- 263 Single Petal St
- 1323 Winter Solstice Ave
- 1078 Broomfield Dr
- 1157 Toro Hills Ct
- 1371 Bear Brook Ave
- 209 Winterport St
- 1211 Evening Canyon Ave
- 220 Winnsboro St
- 1410 Red Sunset Ave
- 316 Desert Knolls St
- 276 Full Wine St
- 1048 Painted Daisy Ave
- 1425 Hometown Ave
- 1025 Tabor Hill Ave
- 239 Paradise Bird St
- 240 Oxford Cloth Ct
- 237 Paradise Bird St
- 1116 Kabuki Ave
- 1114 Kabuki Ave
- 1118 Kabuki Ave
- 242 Paradise Bird St
- 240 Paradise Bird St
- 1112 Kabuki Ave
- 238 Paradise Bird St
- 1120 Kabuki Ave
- 236 Oxford Cloth Ct
- 235 Paradise Bird St
- 1110 Kabuki Ave
- 1122 Kabuki Ave
- 1107 Kabuki Ave
- 239 Oxford Cloth Ct
- 239 Oxford Cloth Ct Unit n/a
- 234 Oxford Cloth Ct
- 233 Paradise Bird St