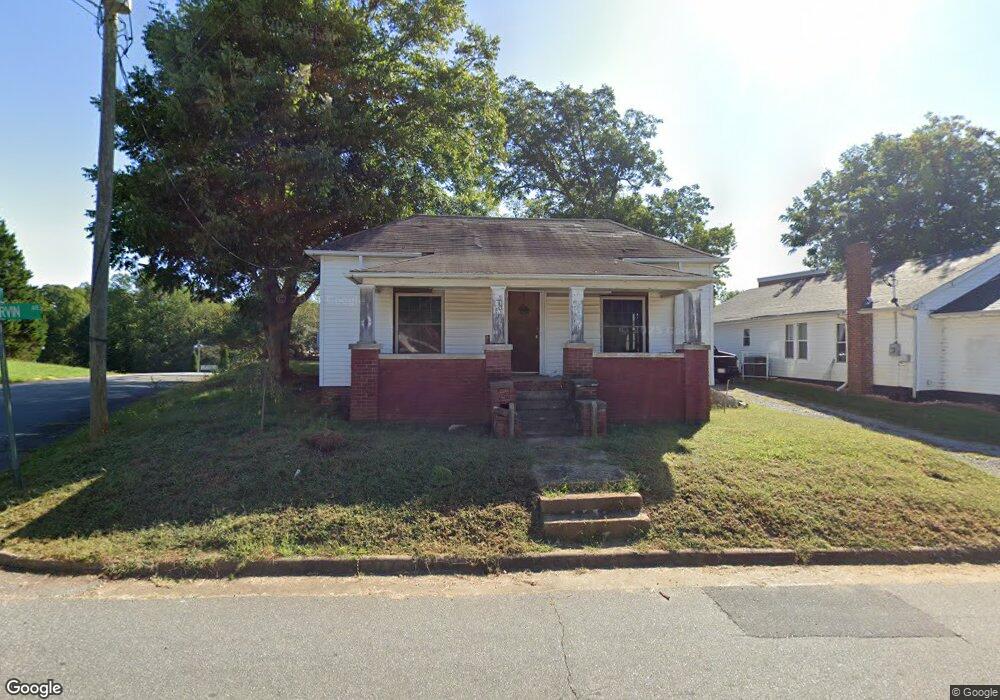
241 S Ervin Ave Newton, NC 28658
Estimated Value: $124,335 - $182,000
2
Beds
1
Bath
945
Sq Ft
$160/Sq Ft
Est. Value
About This Home
This home is located at 241 S Ervin Ave, Newton, NC 28658 and is currently estimated at $151,334, approximately $160 per square foot. 241 S Ervin Ave is a home located in Catawba County with nearby schools including South Newton Elementary School, Newton-Conover Middle School, and Newton-Conover High School.
Ownership History
Date
Name
Owned For
Owner Type
Purchase Details
Closed on
Feb 11, 2023
Sold by
Hecht Amy Allison and Hecht Claudia
Bought by
Morales Jimenez Epifanio
Current Estimated Value
Purchase Details
Closed on
Oct 25, 2019
Sold by
Cruz Fernando Serrano and Cruz Jamie Serrano
Bought by
Hecht Amy Allison
Purchase Details
Closed on
Sep 5, 2017
Sold by
Zaghari Mohammad M and Bernal Gladys G
Bought by
Cruz Fernando Serrano
Purchase Details
Closed on
Aug 3, 2016
Sold by
Varner John P and Varner Tammy F
Bought by
Zaghari Mohammad M and Bernal Gladys G
Home Financials for this Owner
Home Financials are based on the most recent Mortgage that was taken out on this home.
Original Mortgage
$2,500
Interest Rate
3.42%
Purchase Details
Closed on
Sep 14, 2007
Sold by
Barber Rosa Lee and Barber Glenn Earl
Bought by
U S Bank Na
Purchase Details
Closed on
Aug 1, 1982
Create a Home Valuation Report for This Property
The Home Valuation Report is an in-depth analysis detailing your home's value as well as a comparison with similar homes in the area
Home Values in the Area
Average Home Value in this Area
Purchase History
| Date | Buyer | Sale Price | Title Company |
|---|---|---|---|
| Morales Jimenez Epifanio | $35,000 | -- | |
| Hecht Amy Allison | $10,000 | None Available | |
| Cruz Fernando Serrano | $110,000 | None Available | |
| Zaghari Mohammad M | $5,000 | Attorney | |
| U S Bank Na | $27,200 | None Available | |
| -- | $5,500 | -- |
Source: Public Records
Mortgage History
| Date | Status | Borrower | Loan Amount |
|---|---|---|---|
| Previous Owner | Zaghari Mohammad M | $2,500 |
Source: Public Records
Tax History Compared to Growth
Tax History
| Year | Tax Paid | Tax Assessment Tax Assessment Total Assessment is a certain percentage of the fair market value that is determined by local assessors to be the total taxable value of land and additions on the property. | Land | Improvement |
|---|---|---|---|---|
| 2025 | $972 | $114,600 | $5,400 | $109,200 |
| 2024 | $972 | $114,600 | $5,400 | $109,200 |
| 2023 | $972 | $114,600 | $5,400 | $109,200 |
| 2022 | $507 | $45,500 | $5,400 | $40,100 |
| 2021 | $507 | $45,500 | $5,400 | $40,100 |
| 2020 | $507 | $45,500 | $5,400 | $40,100 |
| 2019 | $507 | $45,500 | $0 | $0 |
| 2018 | $438 | $39,300 | $5,300 | $34,000 |
| 2017 | $438 | $0 | $0 | $0 |
| 2016 | $438 | $0 | $0 | $0 |
| 2015 | $384 | $39,300 | $5,300 | $34,000 |
| 2014 | $384 | $38,000 | $5,200 | $32,800 |
Source: Public Records
Map
Nearby Homes
- 215 S Ervin Ave
- 125 S Ervin Ave
- 406 S Caldwell Ave
- 127 S Caldwell Ave
- 1241 E I St Unit 20
- 1251 E I St
- 624 Overlook Dr
- 1492 Mulberry Ridge Dr
- 1502 Mulberry Ridge Dr Unit 1
- 1522 Cannan Mountain Dr
- 355 S College Ave
- 216 N Davis Ave
- 300 N Ervin Ave
- 743 S College Ave
- 103 W Herman St
- 215 W D St
- 426B E N St
- 230 Park Ln
- 1656 Piper Creek Ave
- 1401 Southwest Blvd