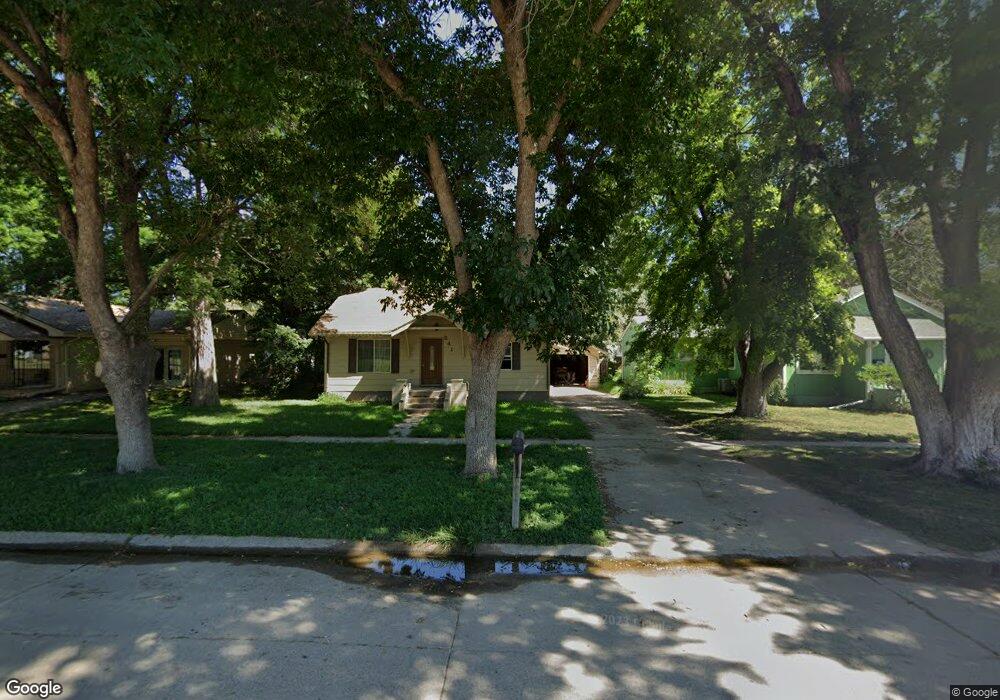
241 S G St Broken Bow, NE 68822
Estimated Value: $70,000 - $131,000
--
Bed
--
Bath
896
Sq Ft
$109/Sq Ft
Est. Value
About This Home
This home is located at 241 S G St, Broken Bow, NE 68822 and is currently estimated at $98,100, approximately $109 per square foot. 241 S G St is a home located in Custer County with nearby schools including North Park Elementary School, Broken Bow Junior High School, and Broken Bow High School.
Ownership History
Date
Name
Owned For
Owner Type
Purchase Details
Closed on
Mar 18, 2010
Sold by
G8 Capital Fund V Llc
Bought by
Jacobson Daniel C and Jacobson Linda L
Current Estimated Value
Purchase Details
Closed on
Nov 4, 2009
Sold by
Us Bank National Assn Tre
Bought by
G8 Capital Fund V Llc
Purchase Details
Closed on
May 4, 2009
Sold by
Mach Tonya Etal
Bought by
Us Bank National Ass Tre
Purchase Details
Closed on
Apr 25, 2005
Sold by
Mach Tonya K
Bought by
Mach Tonya
Create a Home Valuation Report for This Property
The Home Valuation Report is an in-depth analysis detailing your home's value as well as a comparison with similar homes in the area
Home Values in the Area
Average Home Value in this Area
Purchase History
| Date | Buyer | Sale Price | Title Company |
|---|---|---|---|
| Jacobson Daniel C | $12,700 | -- | |
| G8 Capital Fund V Llc | $8,200 | -- | |
| Us Bank National Ass Tre | $30,000 | -- | |
| Mach Tonya | $35,600 | -- |
Source: Public Records
Tax History Compared to Growth
Tax History
| Year | Tax Paid | Tax Assessment Tax Assessment Total Assessment is a certain percentage of the fair market value that is determined by local assessors to be the total taxable value of land and additions on the property. | Land | Improvement |
|---|---|---|---|---|
| 2025 | $715 | $69,221 | $8,131 | $61,090 |
| 2024 | $715 | $53,348 | $8,131 | $45,217 |
| 2023 | $867 | $55,359 | $8,131 | $47,228 |
| 2022 | $958 | $52,186 | $8,131 | $44,055 |
| 2021 | $923 | $51,447 | $7,392 | $44,055 |
| 2020 | $915 | $51,447 | $7,392 | $44,055 |
| 2019 | $785 | $44,193 | $5,544 | $38,649 |
| 2017 | $658 | $36,049 | $5,544 | $30,505 |
| 2016 | $682 | $34,127 | $3,622 | $30,505 |
| 2015 | $662 | $32,863 | $3,575 | $29,288 |
| 2014 | $662 | $29,875 | $3,250 | $26,625 |
Source: Public Records
Map
Nearby Homes