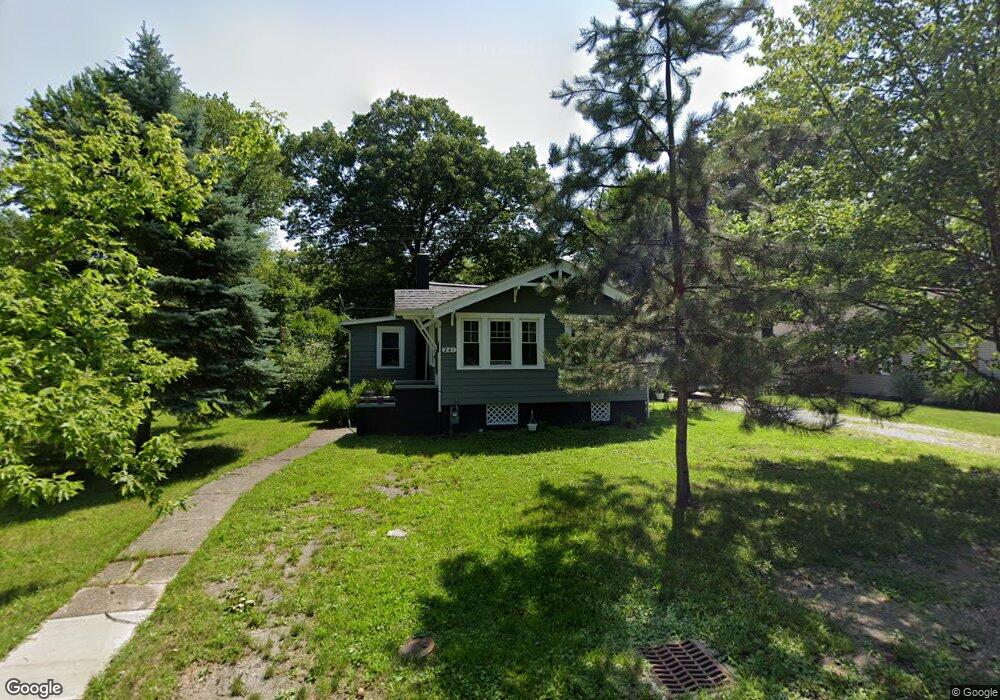
241 S Point Dr Avon Lake, OH 44012
Estimated Value: $191,000 - $254,000
3
Beds
1
Bath
1,120
Sq Ft
$200/Sq Ft
Est. Value
About This Home
This home is located at 241 S Point Dr, Avon Lake, OH 44012 and is currently estimated at $223,615, approximately $199 per square foot. 241 S Point Dr is a home located in Lorain County with nearby schools including Eastview Elementary School, Troy Intermediate Elementary School, and Learwood Middle School.
Ownership History
Date
Name
Owned For
Owner Type
Purchase Details
Closed on
Jun 23, 2022
Sold by
Helping Hand Pm Llc
Bought by
Albert Washington Llc
Current Estimated Value
Home Financials for this Owner
Home Financials are based on the most recent Mortgage that was taken out on this home.
Original Mortgage
$108,750
Outstanding Balance
$103,321
Interest Rate
5.1%
Mortgage Type
New Conventional
Estimated Equity
$120,294
Purchase Details
Closed on
Dec 16, 2021
Sold by
Tomco John F
Bought by
Helping Hand Pm Llc
Home Financials for this Owner
Home Financials are based on the most recent Mortgage that was taken out on this home.
Original Mortgage
$135,900
Interest Rate
3.09%
Mortgage Type
Commercial
Purchase Details
Closed on
Feb 2, 2010
Sold by
Felix Paul A and Felix Charlene
Bought by
Tomco John F
Create a Home Valuation Report for This Property
The Home Valuation Report is an in-depth analysis detailing your home's value as well as a comparison with similar homes in the area
Home Values in the Area
Average Home Value in this Area
Purchase History
| Date | Buyer | Sale Price | Title Company |
|---|---|---|---|
| Albert Washington Llc | -- | None Listed On Document | |
| Helping Hand Pm Llc | $116,000 | Erieview Title Agency Llc | |
| Tomco John F | $85,000 | True Title Agency Inc |
Source: Public Records
Mortgage History
| Date | Status | Borrower | Loan Amount |
|---|---|---|---|
| Open | Albert Washington Llc | $108,750 | |
| Previous Owner | Helping Hand Pm Llc | $135,900 |
Source: Public Records
Tax History Compared to Growth
Tax History
| Year | Tax Paid | Tax Assessment Tax Assessment Total Assessment is a certain percentage of the fair market value that is determined by local assessors to be the total taxable value of land and additions on the property. | Land | Improvement |
|---|---|---|---|---|
| 2024 | $2,593 | $53,375 | $13,552 | $39,823 |
| 2023 | $1,824 | $33,383 | $8,712 | $24,672 |
| 2022 | $1,806 | $33,383 | $8,712 | $24,672 |
| 2021 | $1,802 | $33,383 | $8,712 | $24,672 |
| 2020 | $1,612 | $27,680 | $7,220 | $20,460 |
| 2019 | $1,604 | $27,680 | $7,220 | $20,460 |
| 2018 | $1,609 | $27,680 | $7,220 | $20,460 |
| 2017 | $1,487 | $23,540 | $5,670 | $17,870 |
| 2016 | $1,480 | $23,540 | $5,670 | $17,870 |
| 2015 | $1,487 | $23,540 | $5,670 | $17,870 |
| 2014 | $1,373 | $20,720 | $4,990 | $15,730 |
| 2013 | $1,384 | $20,720 | $4,990 | $15,730 |
Source: Public Records
Map
Nearby Homes
- 235 S Point Dr
- 239 S Point Dr
- 161 Tomahawk Dr
- 208 Westwind Dr
- 191 Norman Ave
- 225 Westwind Dr Unit 39
- 225 Westwind Dr Unit 33
- 225 Westwind Dr Unit 2
- 124 Norman Ave
- 110 Oakwood Dr
- 372 Harbor Ct
- 31910 Lake Rd
- 31918 Lake Rd
- 31791 Lake Rd
- 32150 Ventanas Cir
- 32062 Tuscan Ln Unit L-4
- 32054 Tuscan Ln Unit L-2
- 309 Bayview Dr
- 32012 Tuscan Ln
- The Capri Plan at Tuscan Village
- 241 S Point Dr
- 243 S Point Dr
- 178 Tomahawk Dr
- 242 S Point Dr
- 170 Tomahawk Dr
- 240 S Point Dr
- 246 S Point Dr
- 168 Tomahawk Dr
- 180 Tomahawk Dr
- 233 S Point Dr
- 234 S Point Dr
- 248 S Point Dr
- 174 Tomahawk Dr
- 249 S Point Dr
- 237 S Point Dr
- 166 Tomahawk Dr
- 177 Forest Blvd
- 252 S Point Dr
- 175 Forest Blvd
- 232 S Point Dr