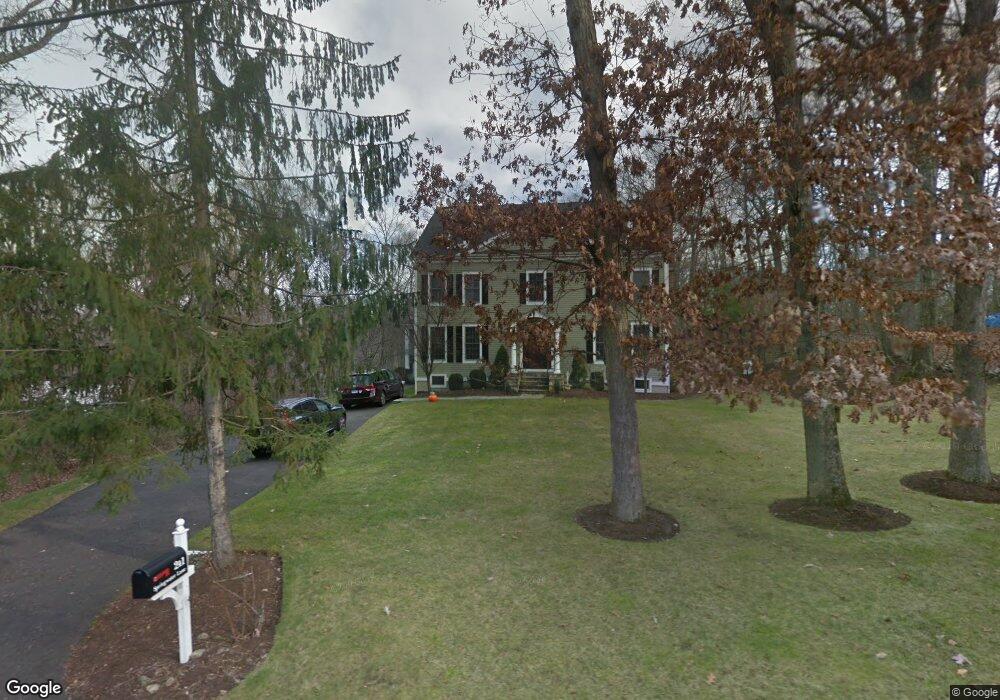
241 Spring Water Ln New Canaan, CT 06840
Estimated Value: $3,059,000 - $3,432,000
5
Beds
6
Baths
4,405
Sq Ft
$739/Sq Ft
Est. Value
About This Home
This home is located at 241 Spring Water Ln, New Canaan, CT 06840 and is currently estimated at $3,254,129, approximately $738 per square foot. 241 Spring Water Ln is a home located in Fairfield County with nearby schools including West Elementary School, Saxe Middle School, and New Canaan High School.
Ownership History
Date
Name
Owned For
Owner Type
Purchase Details
Closed on
Jul 2, 2007
Sold by
England Jeffrey L and England Cindy R
Bought by
Michell George R
Current Estimated Value
Home Financials for this Owner
Home Financials are based on the most recent Mortgage that was taken out on this home.
Original Mortgage
$1,000,000
Outstanding Balance
$622,668
Interest Rate
6.25%
Estimated Equity
$2,631,461
Purchase Details
Closed on
Oct 29, 2003
Sold by
Boatwalla Cyrus and Wiggin Mejo
Bought by
England Jeffrey L and England Cindy R
Purchase Details
Closed on
Aug 24, 2001
Sold by
Ohara James and Ohara Maureen
Bought by
Boatwalla Cyrus and Wiggins Mejo
Purchase Details
Closed on
Aug 2, 1996
Sold by
241 Springwater Ln Llc
Bought by
Buckley Maureen J and Ohora James T
Purchase Details
Closed on
Mar 24, 1995
Sold by
Warden Ellen S
Bought by
241 Spring Water Ln
Create a Home Valuation Report for This Property
The Home Valuation Report is an in-depth analysis detailing your home's value as well as a comparison with similar homes in the area
Home Values in the Area
Average Home Value in this Area
Purchase History
| Date | Buyer | Sale Price | Title Company |
|---|---|---|---|
| Michell George R | $2,310,000 | -- | |
| England Jeffrey L | $777,000 | -- | |
| Boatwalla Cyrus | $565,000 | -- | |
| Buckley Maureen J | $355,000 | -- | |
| 241 Spring Water Ln | $250,000 | -- |
Source: Public Records
Mortgage History
| Date | Status | Borrower | Loan Amount |
|---|---|---|---|
| Open | 241 Spring Water Ln | $533,000 | |
| Open | 241 Spring Water Ln | $1,000,000 |
Source: Public Records
Tax History Compared to Growth
Tax History
| Year | Tax Paid | Tax Assessment Tax Assessment Total Assessment is a certain percentage of the fair market value that is determined by local assessors to be the total taxable value of land and additions on the property. | Land | Improvement |
|---|---|---|---|---|
| 2025 | $28,371 | $1,699,880 | $654,500 | $1,045,380 |
| 2024 | $27,436 | $1,699,880 | $654,500 | $1,045,380 |
| 2023 | $25,837 | $1,364,160 | $600,670 | $763,490 |
| 2022 | $25,060 | $1,364,160 | $600,670 | $763,490 |
| 2021 | $24,773 | $1,364,160 | $600,670 | $763,490 |
| 2020 | $24,773 | $1,364,160 | $600,670 | $763,490 |
| 2019 | $24,882 | $1,364,160 | $600,670 | $763,490 |
| 2018 | $25,080 | $1,478,750 | $556,150 | $922,600 |
| 2017 | $24,651 | $1,478,750 | $556,150 | $922,600 |
| 2016 | $24,118 | $1,478,750 | $556,150 | $922,600 |
| 2015 | $24,488 | $1,478,750 | $556,150 | $922,600 |
| 2014 | $22,980 | $1,478,750 | $556,150 | $922,600 |
Source: Public Records
Map
Nearby Homes
- 100 Spring Water Ln
- 202 Weed St
- 139 Jelliff Mill Rd
- 357 Jelliff Mill Rd
- 470 Frogtown Rd Unit Lot 1
- 39 Running Brook Ln
- 113 Skyview Ln
- 474 Ponus Ridge
- 865 Hollow Tree Ridge Rd
- 25 Gower Rd
- 1552 Hope St
- 317 Park St
- 354 South Ave
- 197 Park St Unit 13
- 119 Wedgemere Rd
- 50 Harrison Ave
- 52 Putnam Rd
- 77 Putter Dr
- 109 Stephen Mather Rd
- 44 Putnam Rd
- 253 Spring Water Ln
- 231 Spring Water Ln
- 261 Spring Water Ln
- 259 Spring Water Ln
- 171 Spring Water Ln
- 248 Spring Water Ln
- 269 Spring Water Ln
- 215 Spring Water Ln
- 215 Spring Water Ln Unit Bedroom Suite
- 155 Hillcrest Rd
- 161 Spring Water Ln
- 263 Spring Water Ln
- 265 Spring Water Ln
- 288 Spring Water Ln
- 161 Spring Water Ln
- 144 Hillcrest Rd
- 11 Hillcrest Rd
- 170 Weed St
- 139 Hillcrest Rd
- 158 Spring Water Ln