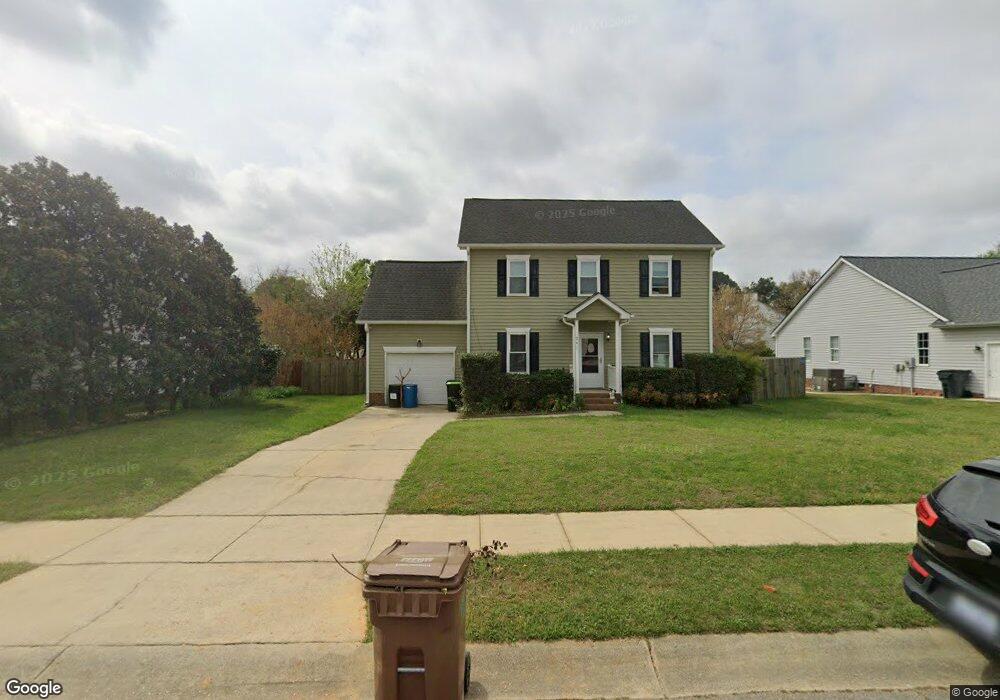
241 Springside Dr Holly Springs, NC 27540
Estimated Value: $389,000 - $402,000
3
Beds
3
Baths
1,462
Sq Ft
$271/Sq Ft
Est. Value
About This Home
This home is located at 241 Springside Dr, Holly Springs, NC 27540 and is currently estimated at $396,333, approximately $271 per square foot. 241 Springside Dr is a home located in Wake County with nearby schools including Holly Ridge Elementary School, Holly Springs High School, and Pine Springs Prep Academy.
Ownership History
Date
Name
Owned For
Owner Type
Purchase Details
Closed on
Aug 7, 2015
Sold by
Key Mark A and Key Tamecia D
Bought by
Stephens James and Stephens Laura C
Current Estimated Value
Home Financials for this Owner
Home Financials are based on the most recent Mortgage that was taken out on this home.
Original Mortgage
$175,824
Outstanding Balance
$138,096
Interest Rate
3.99%
Mortgage Type
FHA
Estimated Equity
$258,237
Purchase Details
Closed on
Aug 25, 1999
Sold by
Apolloni Maria and Kaeser William E
Bought by
Key Mark A and Key Tamecia D
Home Financials for this Owner
Home Financials are based on the most recent Mortgage that was taken out on this home.
Original Mortgage
$131,785
Interest Rate
7.58%
Mortgage Type
FHA
Purchase Details
Closed on
Nov 24, 1998
Sold by
Paradise Homes Inc
Bought by
Apolloni Maria
Home Financials for this Owner
Home Financials are based on the most recent Mortgage that was taken out on this home.
Original Mortgage
$117,900
Interest Rate
6.47%
Create a Home Valuation Report for This Property
The Home Valuation Report is an in-depth analysis detailing your home's value as well as a comparison with similar homes in the area
Home Values in the Area
Average Home Value in this Area
Purchase History
| Date | Buyer | Sale Price | Title Company |
|---|---|---|---|
| Stephens James | $180,000 | Attorney | |
| Key Mark A | $132,000 | -- | |
| Apolloni Maria | $132,000 | -- |
Source: Public Records
Mortgage History
| Date | Status | Borrower | Loan Amount |
|---|---|---|---|
| Open | Stephens James | $175,824 | |
| Previous Owner | Key Mark A | $131,785 | |
| Previous Owner | Apolloni Maria | $117,900 |
Source: Public Records
Tax History Compared to Growth
Tax History
| Year | Tax Paid | Tax Assessment Tax Assessment Total Assessment is a certain percentage of the fair market value that is determined by local assessors to be the total taxable value of land and additions on the property. | Land | Improvement |
|---|---|---|---|---|
| 2025 | $3,280 | $378,767 | $120,000 | $258,767 |
| 2024 | $3,266 | $378,767 | $120,000 | $258,767 |
| 2023 | $2,712 | $249,551 | $70,000 | $179,551 |
| 2022 | $2,618 | $249,551 | $70,000 | $179,551 |
| 2021 | $2,569 | $249,551 | $70,000 | $179,551 |
| 2020 | $2,569 | $249,551 | $70,000 | $179,551 |
| 2019 | $2,198 | $181,022 | $50,000 | $131,022 |
| 2018 | $1,988 | $181,022 | $50,000 | $131,022 |
| 2017 | $1,916 | $181,022 | $50,000 | $131,022 |
| 2016 | $1,890 | $181,022 | $50,000 | $131,022 |
| 2015 | $1,707 | $160,724 | $36,000 | $124,724 |
| 2014 | $1,648 | $160,724 | $36,000 | $124,724 |
Source: Public Records
Map
Nearby Homes
- 308 E Maple Ave
- 421 Grigsby Ave
- 717 Utley St
- 220 Avent Ferry Rd
- 401 Vista Springs Cir
- 4014 Kentworth Dr
- 144 Holly Mountain Rd
- 2027 Hayes Ln
- 141 Spring Pine Ln
- 705 Morton Farm Rd
- 405 W Ballentine St
- 225 Seneca Shore Dr
- 109 Lacombe Ct
- 137 Lacombe Ct
- 116 Cabrita Ct
- 121 Cassada Ct
- 104 Chilmark Ridge Dr
- 408 Teal Lake Dr
- 105 Cross Hill Ln
- 504 Prince Dr
- 237 Springside Dr
- 245 Springside Dr
- 100 Uphill Ct
- 104 Uphill Ct
- 235 Springside Dr
- 249 Springside Dr
- 240 Springside Dr
- 101 Uphill Ct
- 244 Springside Dr
- 236 Springside Dr
- 108 Uphill Ct
- 248 Springside Dr
- 232 Springside Dr
- 301 Springside Dr
- 229 Springside Dr
- 105 Uphill Ct
- 252 Springside Dr
- 409 E Maple Ave
- 305 Springside Dr
- 228 Springside Dr