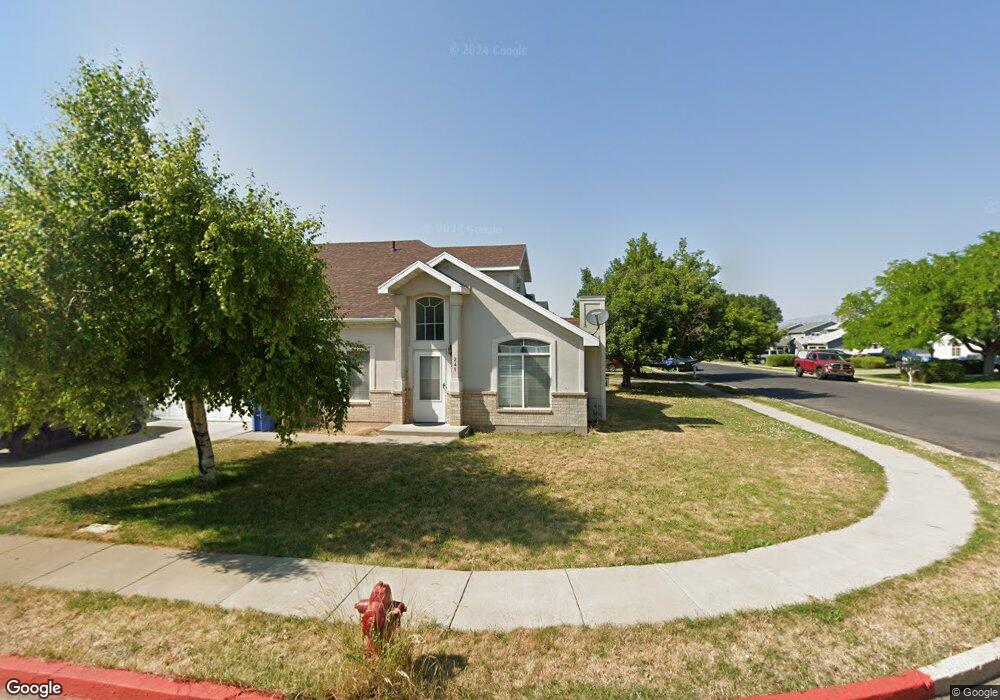
241 W 1140 N Logan, UT 84341
Bridger NeighborhoodEstimated Value: $326,000 - $377,239
3
Beds
2
Baths
1,414
Sq Ft
$244/Sq Ft
Est. Value
About This Home
This home is located at 241 W 1140 N, Logan, UT 84341 and is currently estimated at $345,310, approximately $244 per square foot. 241 W 1140 N is a home located in Cache County with nearby schools including Bridger School, Mount Logan Middle School, and Logan High School.
Ownership History
Date
Name
Owned For
Owner Type
Purchase Details
Closed on
Oct 11, 2024
Sold by
Zavaleta Maria C
Bought by
Zavaleta Maria C and Hess Marisol Guadalupe
Current Estimated Value
Purchase Details
Closed on
Oct 10, 2024
Sold by
Dequinteros Santos M Melendez and Chacon Jose D
Bought by
Zavaleta Maria C and Hess Marisol Guadalupe
Purchase Details
Closed on
May 20, 2010
Sold by
Mccormick Lex and Mccormick Beverly
Bought by
Dequinteros Santos M Melendez and Chacon Jose D Quinteros
Home Financials for this Owner
Home Financials are based on the most recent Mortgage that was taken out on this home.
Original Mortgage
$6,300
Interest Rate
5.05%
Mortgage Type
Stand Alone Second
Purchase Details
Closed on
Jan 27, 2005
Sold by
Parduhn Jacob David and Parduhn Wendy Poulsen
Bought by
Mccormick Lex and Mccormick Beverly
Home Financials for this Owner
Home Financials are based on the most recent Mortgage that was taken out on this home.
Original Mortgage
$25,600
Interest Rate
5.81%
Mortgage Type
Stand Alone Second
Create a Home Valuation Report for This Property
The Home Valuation Report is an in-depth analysis detailing your home's value as well as a comparison with similar homes in the area
Home Values in the Area
Average Home Value in this Area
Purchase History
| Date | Buyer | Sale Price | Title Company |
|---|---|---|---|
| Zavaleta Maria C | -- | Us Title | |
| Zavaleta Maria C | -- | Us Title | |
| Dequinteros Santos M Melendez | -- | Mountain View Title | |
| Mccormick Lex | -- | Mountain View Title |
Source: Public Records
Mortgage History
| Date | Status | Borrower | Loan Amount |
|---|---|---|---|
| Previous Owner | Dequinteros Santos M Melendez | $6,300 | |
| Previous Owner | Dequinteros Santos M Melendez | $140,211 | |
| Previous Owner | Mccormick Lex | $25,600 | |
| Previous Owner | Mccormick Lex | $102,400 |
Source: Public Records
Tax History Compared to Growth
Tax History
| Year | Tax Paid | Tax Assessment Tax Assessment Total Assessment is a certain percentage of the fair market value that is determined by local assessors to be the total taxable value of land and additions on the property. | Land | Improvement |
|---|---|---|---|---|
| 2025 | $1,514 | $355,987 | $132,600 | $223,387 |
| 2024 | $1,563 | $355,987 | $132,600 | $223,387 |
| 2023 | $1,628 | $353,387 | $130,000 | $223,387 |
| 2022 | $149 | $301,387 | $78,000 | $223,387 |
| 2021 | $1,270 | $218,710 | $40,000 | $178,710 |
| 2020 | $1,235 | $191,421 | $40,000 | $151,421 |
| 2019 | $1,291 | $191,420 | $40,000 | $151,420 |
| 2018 | $1,268 | $171,670 | $40,000 | $131,670 |
| 2017 | $1,150 | $82,335 | $0 | $0 |
| 2016 | $1,192 | $78,155 | $0 | $0 |
| 2015 | $1,019 | $70,305 | $0 | $0 |
| 2014 | $921 | $70,305 | $0 | $0 |
| 2013 | -- | $70,305 | $0 | $0 |
Source: Public Records
Map
Nearby Homes
- 2200 N 220 W
- 1030 N 130 W Unit 100
- 897 N 250 W
- 894 N 400 W
- 559 W 1350 N Unit 41
- 873 N 480 W
- 1515 N 450 W Unit 103
- 430 W 810 N
- 514 W 1490 N Unit 102
- 539 W 1465 N Unit 17-102
- 223 W 730 N
- 243 W 730 N
- 420 W 750 N
- 190 W 700 N
- 1492 N 565 W Unit 101
- 235 E 1100 N
- 227 W 690 N
- 702 N 100 W
- 446 W 1595 N Unit 103
- 345 W 690 N