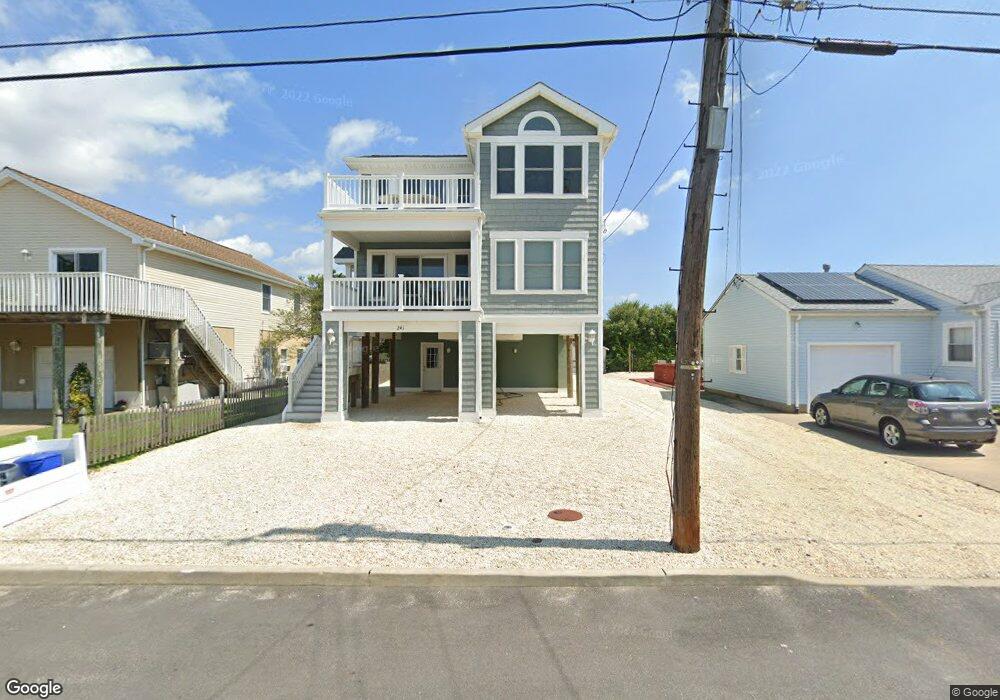
241 W 21st St Ship Bottom, NJ 08008
Long Beach Island NeighborhoodEstimated Value: $1,102,000 - $2,001,000
4
Beds
2
Baths
1,232
Sq Ft
$1,211/Sq Ft
Est. Value
About This Home
This home is located at 241 W 21st St, Ship Bottom, NJ 08008 and is currently estimated at $1,491,703, approximately $1,210 per square foot. 241 W 21st St is a home located in Ocean County with nearby schools including Ethel A. Jacobsen Elementary School, Long Beach Island Grade School, and Southern Regional Middle School.
Ownership History
Date
Name
Owned For
Owner Type
Purchase Details
Closed on
Nov 22, 2013
Sold by
Greco William L and Greco John J
Bought by
Yankowski John H and Yankowski Deborah L
Current Estimated Value
Purchase Details
Closed on
May 17, 2006
Sold by
Estate Of Katherine M Greco and Greco William L
Bought by
Greco William L and Greco John J
Home Financials for this Owner
Home Financials are based on the most recent Mortgage that was taken out on this home.
Original Mortgage
$147,000
Interest Rate
6.55%
Mortgage Type
Fannie Mae Freddie Mac
Create a Home Valuation Report for This Property
The Home Valuation Report is an in-depth analysis detailing your home's value as well as a comparison with similar homes in the area
Home Values in the Area
Average Home Value in this Area
Purchase History
| Date | Buyer | Sale Price | Title Company |
|---|---|---|---|
| Yankowski John H | $330,000 | Agent For Westcor Land Ti | |
| Greco William L | -- | None Available |
Source: Public Records
Mortgage History
| Date | Status | Borrower | Loan Amount |
|---|---|---|---|
| Previous Owner | Greco William L | $147,000 |
Source: Public Records
Tax History Compared to Growth
Tax History
| Year | Tax Paid | Tax Assessment Tax Assessment Total Assessment is a certain percentage of the fair market value that is determined by local assessors to be the total taxable value of land and additions on the property. | Land | Improvement |
|---|---|---|---|---|
| 2025 | $8,365 | $694,200 | $325,000 | $369,200 |
| 2024 | $7,976 | $694,200 | $325,000 | $369,200 |
| 2023 | $7,352 | $694,200 | $325,000 | $369,200 |
| 2022 | $7,352 | $694,200 | $325,000 | $369,200 |
| 2021 | $7,317 | $694,200 | $325,000 | $369,200 |
| 2020 | $7,338 | $694,200 | $325,000 | $369,200 |
| 2019 | $7,345 | $694,200 | $325,000 | $369,200 |
| 2018 | $7,359 | $694,200 | $325,000 | $369,200 |
| 2017 | $6,880 | $694,200 | $325,000 | $369,200 |
| 2016 | $6,365 | $575,000 | $267,500 | $307,500 |
| 2015 | $2,889 | $267,500 | $267,500 | $0 |
| 2014 | $3,897 | $361,200 | $267,500 | $93,700 |
Source: Public Records
Map
Nearby Homes
- 2109 Central Ave
- 1903 Pennsylvania Ave
- 1810 Central Ave Unit 15
- 1810 Central Ave Unit 17
- 1219 Long Beach Blvd
- 111 W 18th St Unit 2
- 109 W 26th St
- 1306 Barnegat Ave
- 108 W 10th St
- 1001 Ocean Ave Unit 1017
- 1001 Ocean Ave Unit 1012
- 1001 Ocean Ave Unit C1001
- 3608B Long Beach Blvd
- 3700 W 38th St
- 615 Barnegat Ave
- 605 Long Beach Blvd
- 5 W 40th St
- 2 Northeast Dr
- 2572 E East Bay Ave
- 2561 2nd St