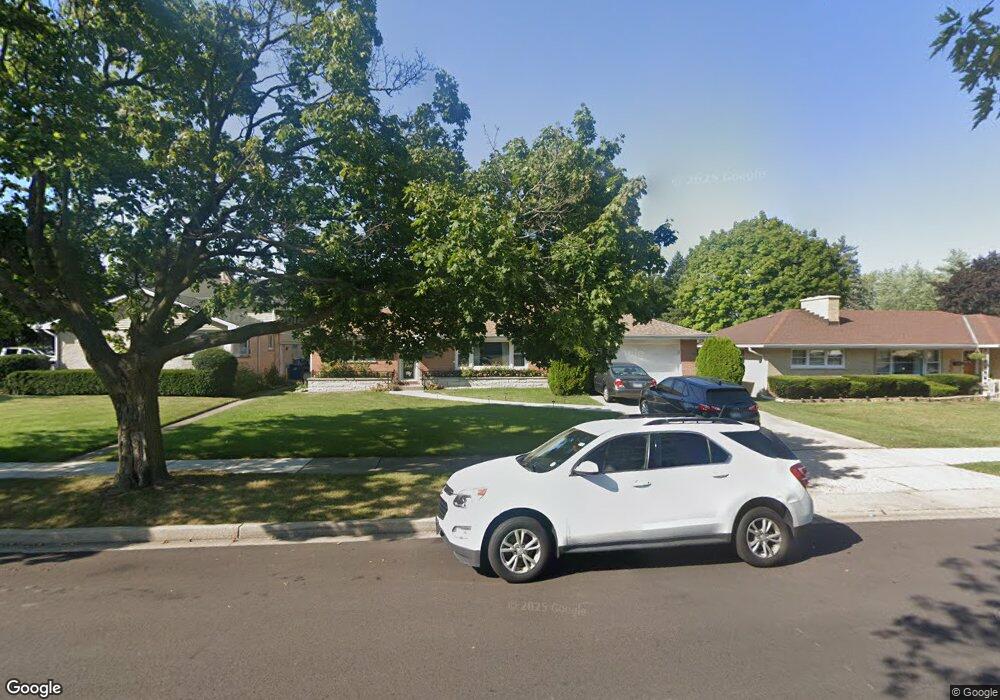
2410 8th Pkwy Waukegan, IL 60085
Norshore Park NeighborhoodEstimated Value: $289,320 - $307,000
3
Beds
2
Baths
1,518
Sq Ft
$197/Sq Ft
Est. Value
About This Home
This home is located at 2410 8th Pkwy, Waukegan, IL 60085 and is currently estimated at $299,580, approximately $197 per square foot. 2410 8th Pkwy is a home located in Lake County with nearby schools including Clearview Elementary School, John R Lewis Middle School, and Waukegan High School.
Ownership History
Date
Name
Owned For
Owner Type
Purchase Details
Closed on
Jun 19, 2000
Sold by
Hud
Bought by
Orozco Jesus V and Orozco Maria A
Current Estimated Value
Home Financials for this Owner
Home Financials are based on the most recent Mortgage that was taken out on this home.
Original Mortgage
$115,000
Outstanding Balance
$40,802
Interest Rate
8.31%
Estimated Equity
$258,778
Purchase Details
Closed on
Feb 9, 2000
Sold by
Gutierrez
Bought by
Hud
Purchase Details
Closed on
Jun 16, 1998
Sold by
Sanchez Jose T and Sanchez Maria T
Bought by
Gutierrez Diego and Martinez Melissa
Home Financials for this Owner
Home Financials are based on the most recent Mortgage that was taken out on this home.
Original Mortgage
$146,984
Interest Rate
7.15%
Mortgage Type
FHA
Purchase Details
Closed on
Jul 27, 1996
Sold by
Sanchez Jose T and Sanchez Maria T
Bought by
Sanchez Jose T and Sanchez Maria T
Create a Home Valuation Report for This Property
The Home Valuation Report is an in-depth analysis detailing your home's value as well as a comparison with similar homes in the area
Home Values in the Area
Average Home Value in this Area
Purchase History
| Date | Buyer | Sale Price | Title Company |
|---|---|---|---|
| Orozco Jesus V | -- | Stewart Title Company | |
| Hud | -- | Wheatland Title | |
| Gutierrez Diego | $150,000 | -- | |
| Sanchez Jose T | -- | Chicago Title Insurance Co |
Source: Public Records
Mortgage History
| Date | Status | Borrower | Loan Amount |
|---|---|---|---|
| Open | Orozco Jesus V | $115,000 | |
| Previous Owner | Gutierrez Diego | $146,984 |
Source: Public Records
Tax History Compared to Growth
Tax History
| Year | Tax Paid | Tax Assessment Tax Assessment Total Assessment is a certain percentage of the fair market value that is determined by local assessors to be the total taxable value of land and additions on the property. | Land | Improvement |
|---|---|---|---|---|
| 2024 | $5,244 | $74,287 | $13,459 | $60,828 |
| 2023 | $4,903 | $63,617 | $11,526 | $52,091 |
| 2022 | $4,903 | $56,158 | $9,994 | $46,164 |
| 2021 | $5,178 | $55,668 | $9,907 | $45,761 |
| 2020 | $5,199 | $51,862 | $9,230 | $42,632 |
| 2019 | $5,179 | $47,523 | $8,458 | $39,065 |
| 2018 | $4,738 | $43,031 | $10,883 | $32,148 |
| 2017 | $4,562 | $38,070 | $9,628 | $28,442 |
| 2016 | $4,185 | $33,081 | $8,366 | $24,715 |
| 2015 | $3,988 | $29,608 | $7,488 | $22,120 |
| 2014 | $4,146 | $30,043 | $8,074 | $21,969 |
| 2012 | $5,358 | $32,548 | $8,747 | $23,801 |
Source: Public Records
Map
Nearby Homes
- 12601 W Atlantic Ave
- 2116 & 2101 Williamsburg Dr
- 2726 W Hidden Glen Dr
- 819 S Fulton Ave
- 1712 11th St
- 3027 Belvidere Rd
- 671 Oldsmar Ln
- 3159 Jeanette Ave
- 3298 7th St
- 3285 Meadow Dr
- 49 S Lewis Ave
- 1511 14th St
- 446 S Jackson St
- 1521 Catalpa Ave
- 910 Cummings Ave
- 24 Washington Terrace
- 102 Baldwin Ave
- 1244 Victoria Ave
- 1521 Seymour Ave
- 815 Prescott St