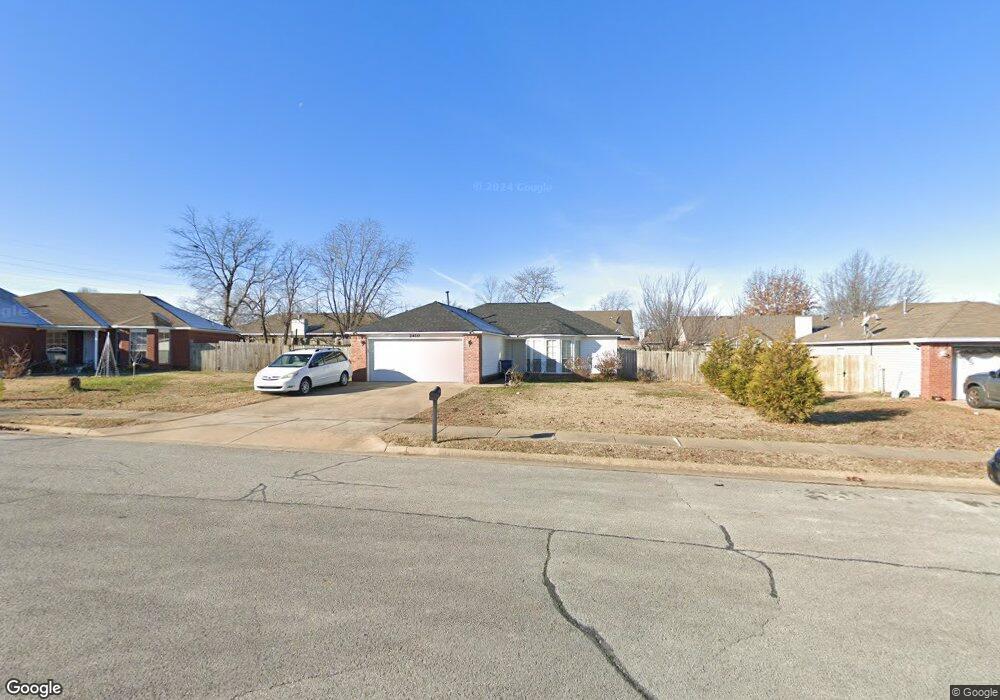
2410 Chanel St Siloam Springs, AR 72761
Estimated Value: $213,000 - $221,000
--
Bed
2
Baths
1,180
Sq Ft
$184/Sq Ft
Est. Value
About This Home
This home is located at 2410 Chanel St, Siloam Springs, AR 72761 and is currently estimated at $217,212, approximately $184 per square foot. 2410 Chanel St is a home located in Benton County with nearby schools including Northside Elementary School, Southside Elementary School, and Delbert Pete & Pat Allen Elementary School.
Ownership History
Date
Name
Owned For
Owner Type
Purchase Details
Closed on
Apr 12, 2011
Sold by
Federal National Mortgage Association
Bought by
Arvest Mortgage Company
Current Estimated Value
Purchase Details
Closed on
Mar 22, 2011
Sold by
Arvest Mortgage Company
Bought by
Federal National Mortgage Association
Purchase Details
Closed on
Mar 18, 2011
Sold by
Landaverde Francisco and Landaverde Luz
Bought by
Arvest Mortgage Company
Purchase Details
Closed on
Jul 27, 2005
Sold by
Resnick Julie Haest and Estate Of Martin J Heast Jr
Bought by
Landaverde Francisco and Landaverde Luz
Home Financials for this Owner
Home Financials are based on the most recent Mortgage that was taken out on this home.
Original Mortgage
$83,100
Interest Rate
5.51%
Mortgage Type
New Conventional
Purchase Details
Closed on
May 7, 2002
Bought by
Haest
Purchase Details
Closed on
Nov 9, 2000
Bought by
Riv Vly
Create a Home Valuation Report for This Property
The Home Valuation Report is an in-depth analysis detailing your home's value as well as a comparison with similar homes in the area
Home Values in the Area
Average Home Value in this Area
Purchase History
| Date | Buyer | Sale Price | Title Company |
|---|---|---|---|
| Arvest Mortgage Company | -- | None Available | |
| Federal National Mortgage Association | -- | None Available | |
| Arvest Mortgage Company | $72,900 | None Available | |
| Landaverde Francisco | $93,000 | None Available | |
| Haest | $312,000 | -- | |
| Riv Vly | $280,000 | -- |
Source: Public Records
Mortgage History
| Date | Status | Borrower | Loan Amount |
|---|---|---|---|
| Previous Owner | Landaverde Francisco | $83,100 |
Source: Public Records
Tax History Compared to Growth
Tax History
| Year | Tax Paid | Tax Assessment Tax Assessment Total Assessment is a certain percentage of the fair market value that is determined by local assessors to be the total taxable value of land and additions on the property. | Land | Improvement |
|---|---|---|---|---|
| 2025 | $1,372 | $38,467 | $8,400 | $30,067 |
| 2024 | $1,344 | $38,467 | $8,400 | $30,067 |
| 2023 | $1,280 | $26,570 | $7,200 | $19,370 |
| 2022 | $849 | $26,570 | $7,200 | $19,370 |
| 2021 | $790 | $26,570 | $7,200 | $19,370 |
| 2020 | $738 | $19,320 | $2,400 | $16,920 |
| 2019 | $738 | $19,320 | $2,400 | $16,920 |
| 2018 | $763 | $19,320 | $2,400 | $16,920 |
| 2017 | $1,054 | $19,320 | $2,400 | $16,920 |
| 2016 | $1,054 | $19,320 | $2,400 | $16,920 |
| 2015 | $958 | $16,640 | $1,600 | $15,040 |
| 2014 | $958 | $16,640 | $1,600 | $15,040 |
Source: Public Records
Map
Nearby Homes
- 2503 Chanel St
- 2711 Summitt Dr
- 2786 S Olive Ct
- 214 Lake Francis Dr
- 110 Cordes Dr
- 2210 E Fennec St
- 0 S Mount Olive St
- 1413 E Emelyn Ln
- 3214 S White Oak St
- 419 W Hannibal St
- 3210 S Lincoln St
- 0000 Elm St S
- 3408 S Lincoln St
- 0 Tbd Hwy 412 W
- TBD W 412 Hwy
- 820 W Deer Lodge Ct
- 1218 E Kenwood St
- 412 W Kenwood St
- 3902 Short Ln
- 882 S Lincoln St
- 2502 Chanel St
- 2408 Chanel St
- 2409 S Washington St
- 2407 S Washington St
- 2505 S Washington St
- 2406 Chanel St
- 2409 Lacy Ct
- 507 Roselawn St
- 509 Roselawn St
- 2405 S Washington St
- 2411 Chanel St
- 2509 S Washington St
- 409 Corrie Ct
- 410 Gray Ct
- 2404 Chanel St
- 2407 Lacy Ct
- 0 Corrie Ct
- 0 Roselawn St Unit 588729
- 0 Roselawn St Unit 588764
- 0 Roselawn St Unit 588774