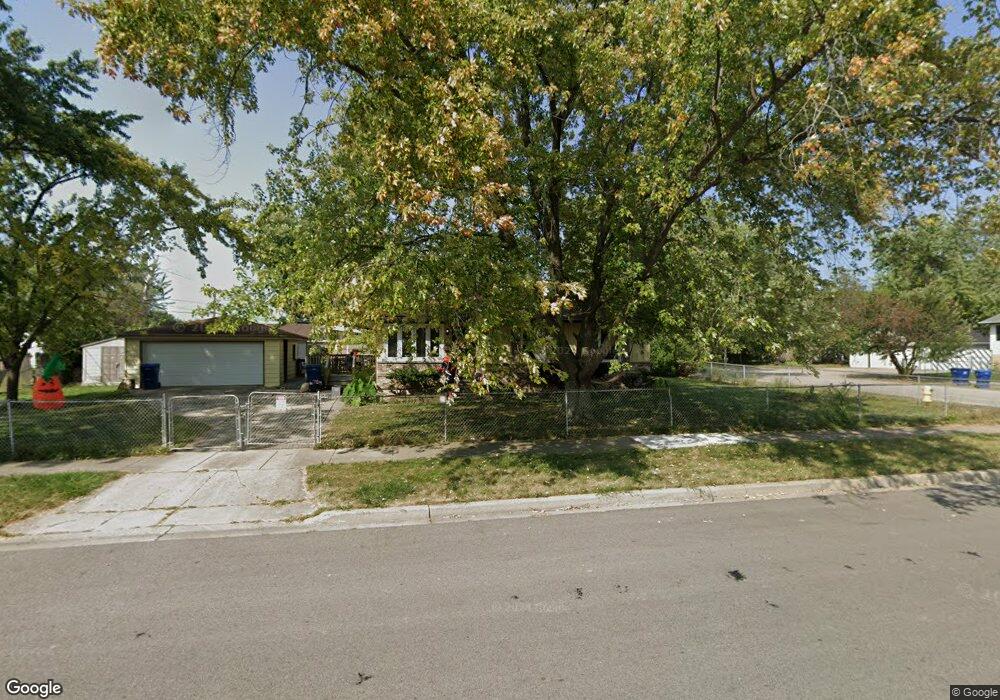
2410 Edgewood Rd Waukegan, IL 60087
Estimated Value: $172,000 - $243,000
3
Beds
1
Bath
1,008
Sq Ft
$203/Sq Ft
Est. Value
About This Home
This home is located at 2410 Edgewood Rd, Waukegan, IL 60087 and is currently estimated at $205,021, approximately $203 per square foot. 2410 Edgewood Rd is a home located in Lake County with nearby schools including H R McCall Elementary School, Jack Benny Middle School, and Waukegan High School.
Ownership History
Date
Name
Owned For
Owner Type
Purchase Details
Closed on
Jan 16, 2025
Sold by
Lewis Ashley and Lewis Richard
Bought by
Coon Stephen W
Current Estimated Value
Home Financials for this Owner
Home Financials are based on the most recent Mortgage that was taken out on this home.
Original Mortgage
$151,098
Outstanding Balance
$150,135
Interest Rate
7.25%
Mortgage Type
FHA
Estimated Equity
$54,886
Purchase Details
Closed on
Dec 22, 2022
Sold by
Lewis Ashley
Bought by
Lewis Ashley and Lewis Richard
Home Financials for this Owner
Home Financials are based on the most recent Mortgage that was taken out on this home.
Original Mortgage
$99,563
Interest Rate
6.63%
Mortgage Type
FHA
Purchase Details
Closed on
May 10, 2018
Sold by
Henson Mackie D and Henson Ruth G
Bought by
Henson Mackie D and Henson Ruth G
Create a Home Valuation Report for This Property
The Home Valuation Report is an in-depth analysis detailing your home's value as well as a comparison with similar homes in the area
Home Values in the Area
Average Home Value in this Area
Purchase History
| Date | Buyer | Sale Price | Title Company |
|---|---|---|---|
| Coon Stephen W | $165,000 | Chicago Title | |
| Lewis Ashley | -- | -- | |
| Lewis Ashley | $101,500 | Proper Title | |
| Henson Mackie D | -- | None Available |
Source: Public Records
Mortgage History
| Date | Status | Borrower | Loan Amount |
|---|---|---|---|
| Open | Coon Stephen W | $151,098 | |
| Previous Owner | Lewis Ashley | $99,563 |
Source: Public Records
Tax History Compared to Growth
Tax History
| Year | Tax Paid | Tax Assessment Tax Assessment Total Assessment is a certain percentage of the fair market value that is determined by local assessors to be the total taxable value of land and additions on the property. | Land | Improvement |
|---|---|---|---|---|
| 2024 | $4,491 | $63,837 | $5,891 | $57,946 |
| 2023 | $3,646 | $56,181 | $5,687 | $50,494 |
| 2022 | $3,646 | $43,743 | $5,555 | $38,188 |
| 2021 | $3,770 | $42,631 | $5,414 | $37,217 |
| 2020 | $3,877 | $40,683 | $5,167 | $35,516 |
| 2019 | $4,010 | $38,598 | $4,902 | $33,696 |
| 2018 | $2,878 | $33,025 | $5,843 | $27,182 |
| 2017 | $2,806 | $31,068 | $5,497 | $25,571 |
| 2016 | $2,818 | $29,577 | $5,233 | $24,344 |
| 2015 | $2,673 | $27,125 | $4,799 | $22,326 |
| 2014 | $3,359 | $31,707 | $9,134 | $22,573 |
| 2012 | $4,168 | $32,949 | $9,492 | $23,457 |
Source: Public Records
Map
Nearby Homes
- 3211 Rugby Ct
- 3101 Country Club Ln
- 3411 N Lewis Ave
- 37966 N Cornell Rd
- 1730 W Beach Rd
- 38683 N Lewis Ave
- 12582 W Beach Rd
- 1636 Rice St
- 12312 W Audrey Ave
- 38127 N Shore Ave
- 38362 N Manor Ave
- 1612 Whitney St
- 38859 N Green Bay Rd
- 2613 N Lewis Ave
- 11345 W Carnahan Ave
- 37905 N Loyola Ave
- 11342-11364 W Wadsworth Rd
- 38697 N Cedar Ave
- 2708 Dana Ave
- 2705 Dana Ave
- 3404 Winhaven Dr
- 3401 Chatham Rd
- 3408 Winhaven Dr
- 3405 Chatham Rd
- 3405 Winhaven Dr
- 2415 Edgewood Rd
- 3412 Winhaven Dr
- 3334 Winhaven Dr
- 2312 Edgewood Rd
- 3415 Winhaven Dr
- 3333 Chatham Rd
- 3335 Winhaven Dr
- 3330 Winhaven Dr
- 2313 Herbert Dr
- 2308 Edgewood Rd
- 3400 Chatham Rd
- 2313 Edgewood Rd
- 3404 Chatham Rd
- 3329 Chatham Rd